Tool
DECIDD
Concurrently view more than 100 indicators to help assess proposed routes for a new TGV line.
Client
SNCF Réseau
Date
2016 - 4 months
Results
The application was used during consultations involving a large number of stakeholders.
We built the DECIDD tool to help SNCF Réseau choose and justify the route for the next TGV line from Paris to Normandy, taking into account more than 100 evaluation criteria. The tool uses data visualization to highlight the strengths and weaknesses of route options, while at the same time clarifying how they have been evaluated.
Problem
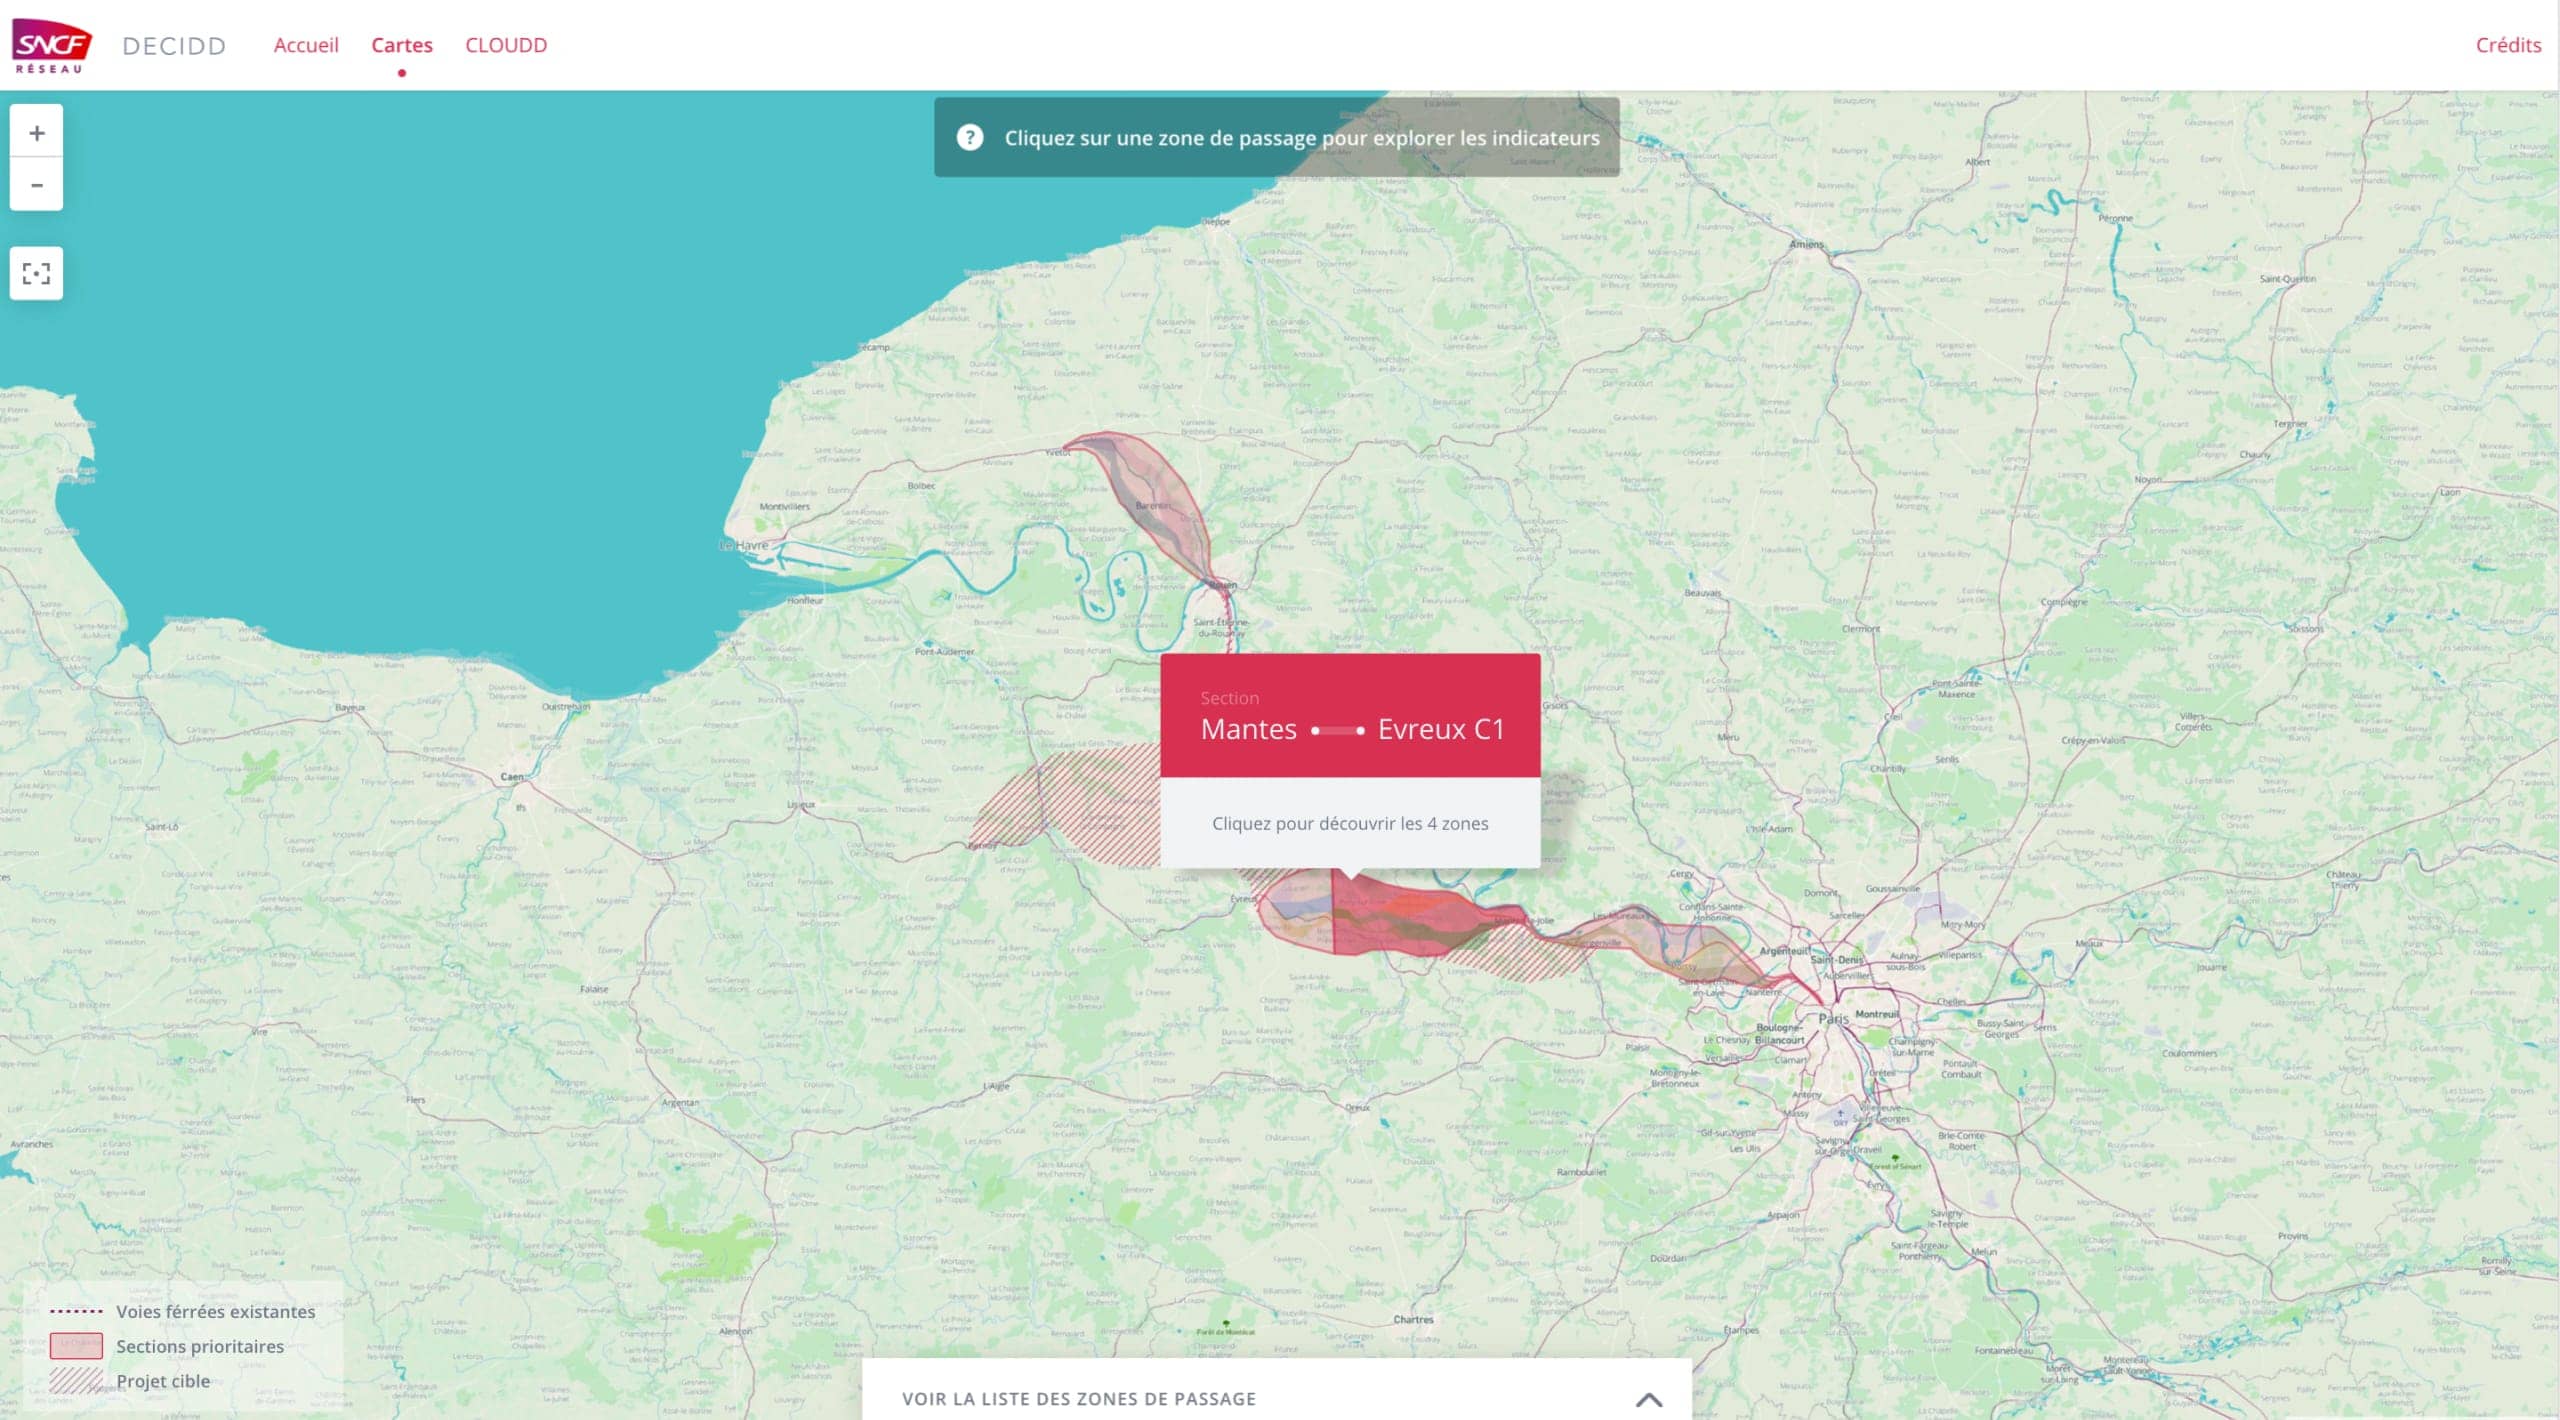
Deciding where to lay the tracks for the new Paris-Normandy TGV line is a big responsibility: depending on the route, towns that will—or won’t—be served, landscapes transformed, and ecological basins turned upside down. To make the right decisions, SNCF Réseau relies on studies that bring together hundreds of heterogeneous indicators. SNCF Réseau needed a decision-making tool capable of reproducing all this information to help make the decision-making process more transparent.
Data
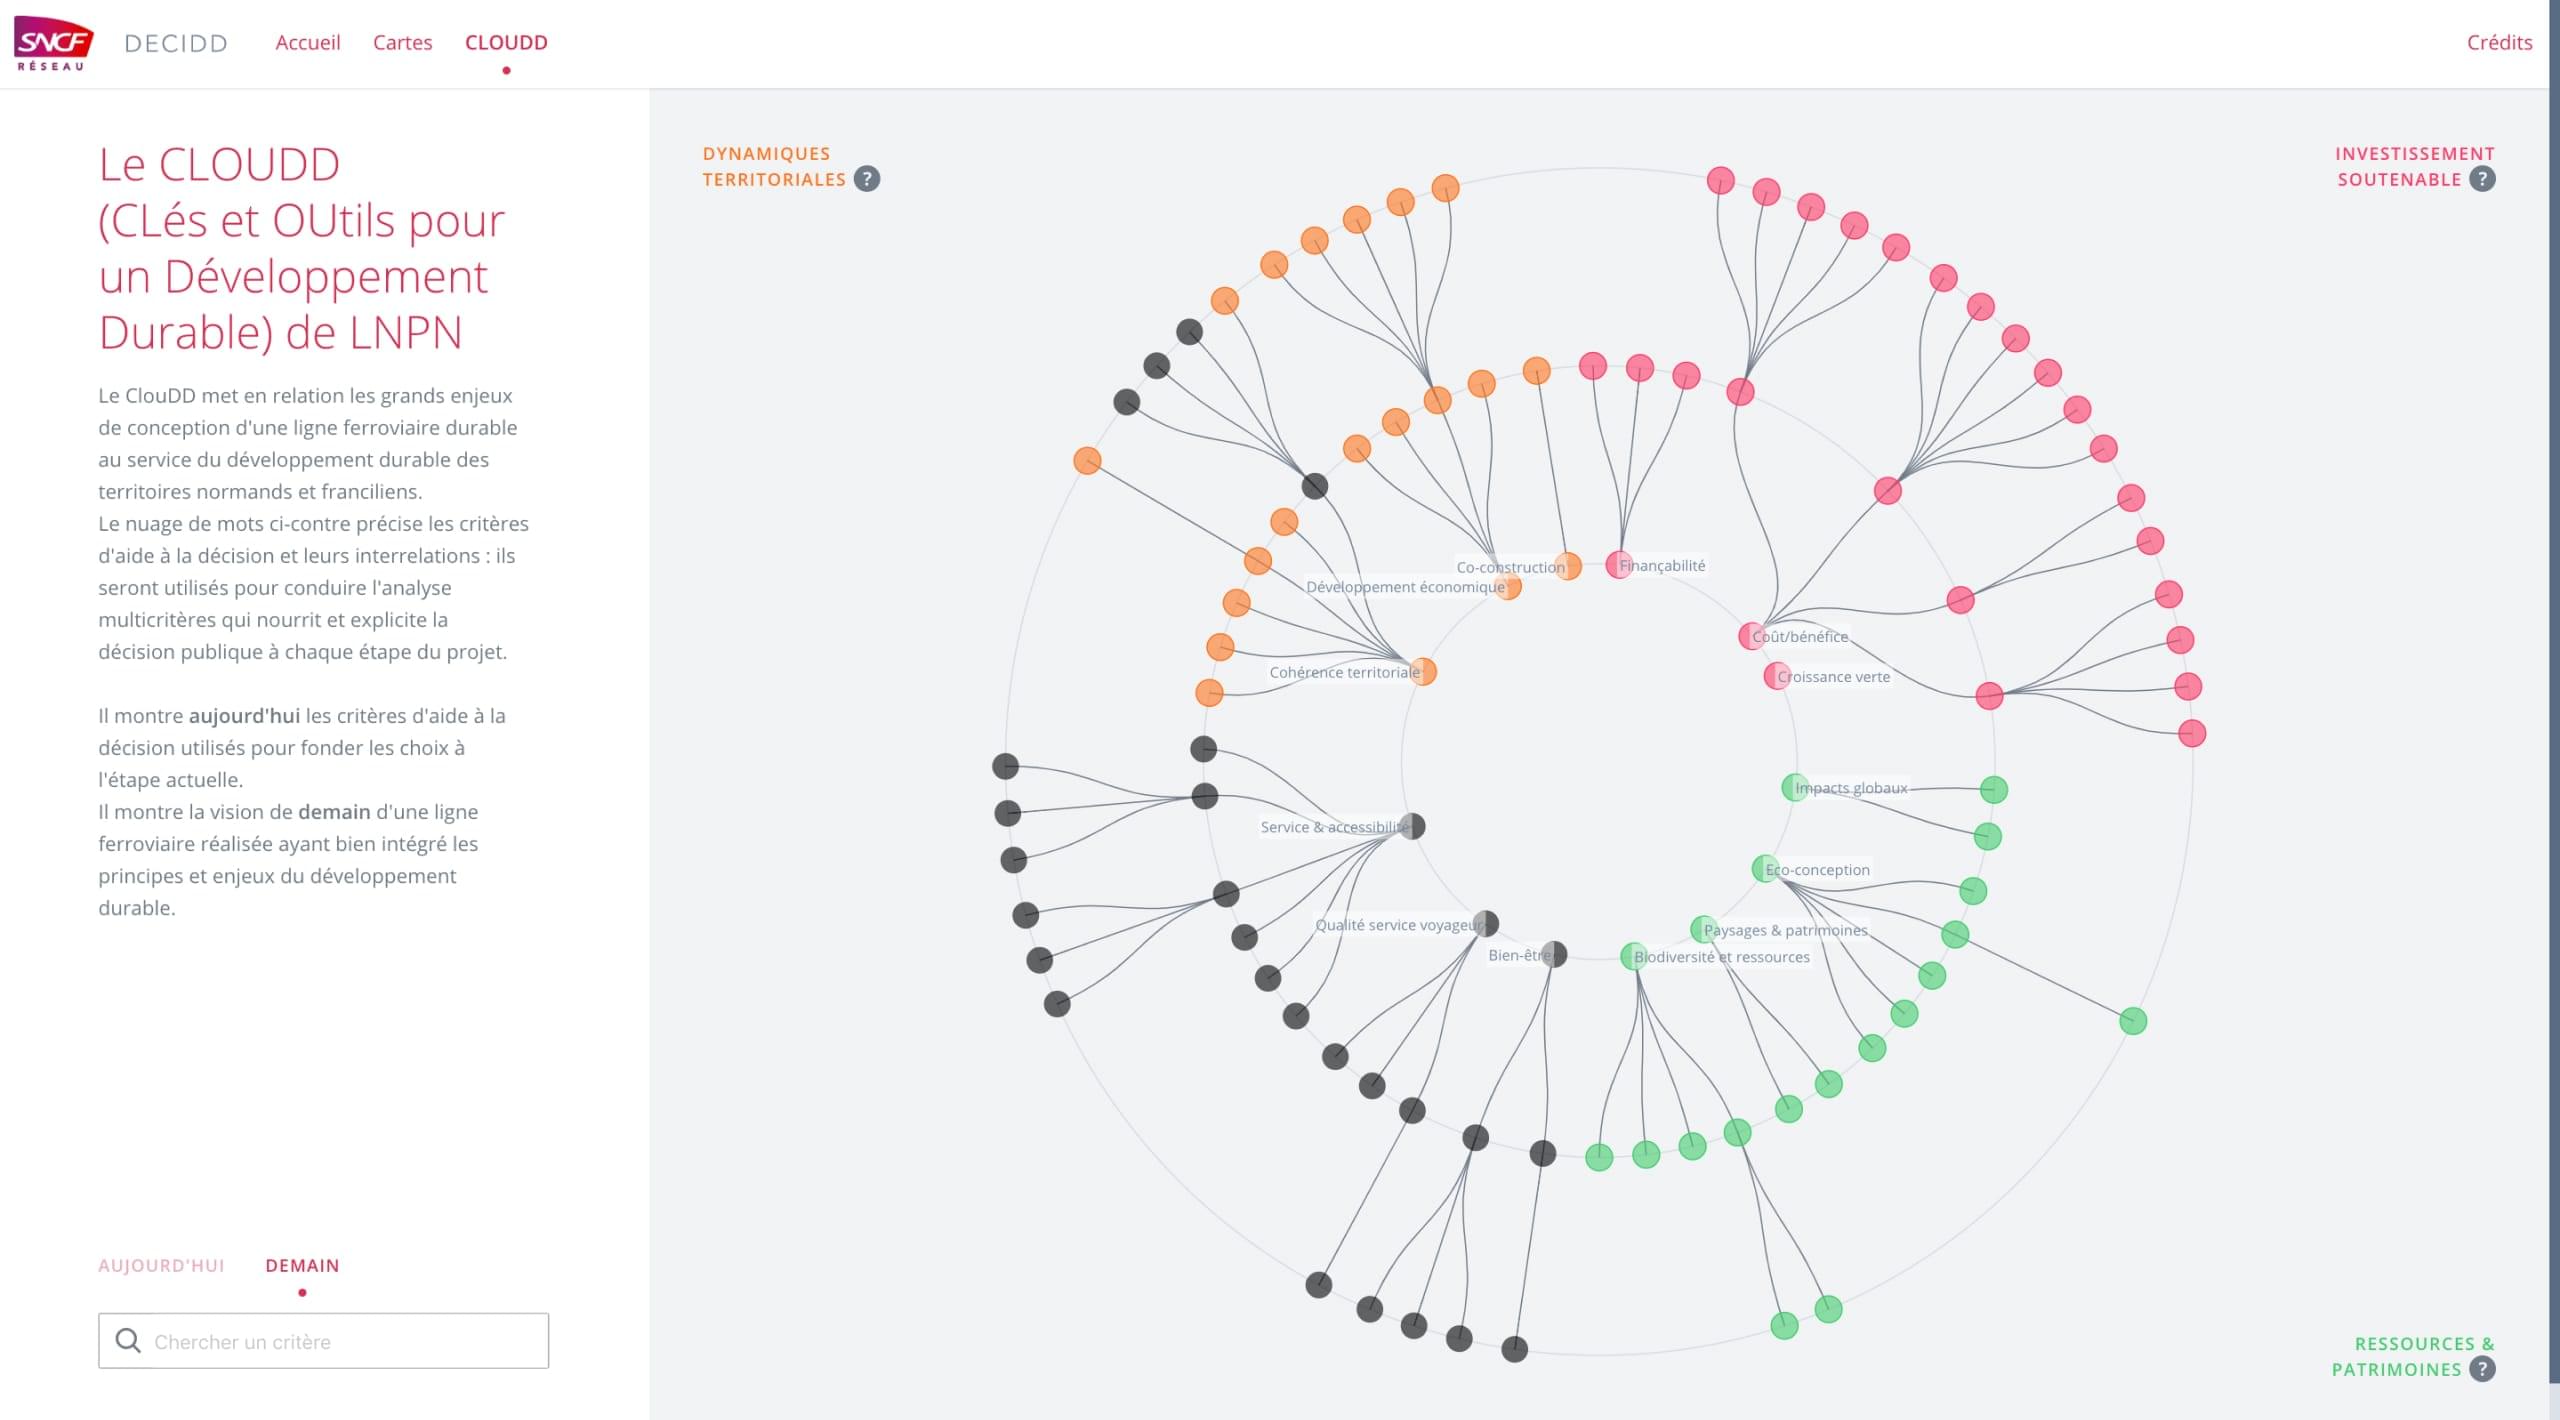
To determine the best possible route for a new TGV line, SNCF Réseau defines the geographical areas likely to accommodate the line and collects data on each of them. A grid with more than 100 criteria and indicators—such as the environmental impact of the route, its cost, travel time, the number of people served, or the support of local citizens—is used to help assess each of these zones.
A very aggregated first reading level shows the performance of the route for each major family of indicators. The user can easily compare, for example, the more environmentally friendly scenario and the most cost-effective option.
Method
We focused our work on two main objectives: first, to help users get to know and use the evaluation tool properly; secondly, to allow users to compare the different route options for the new Paris-Normandy line.
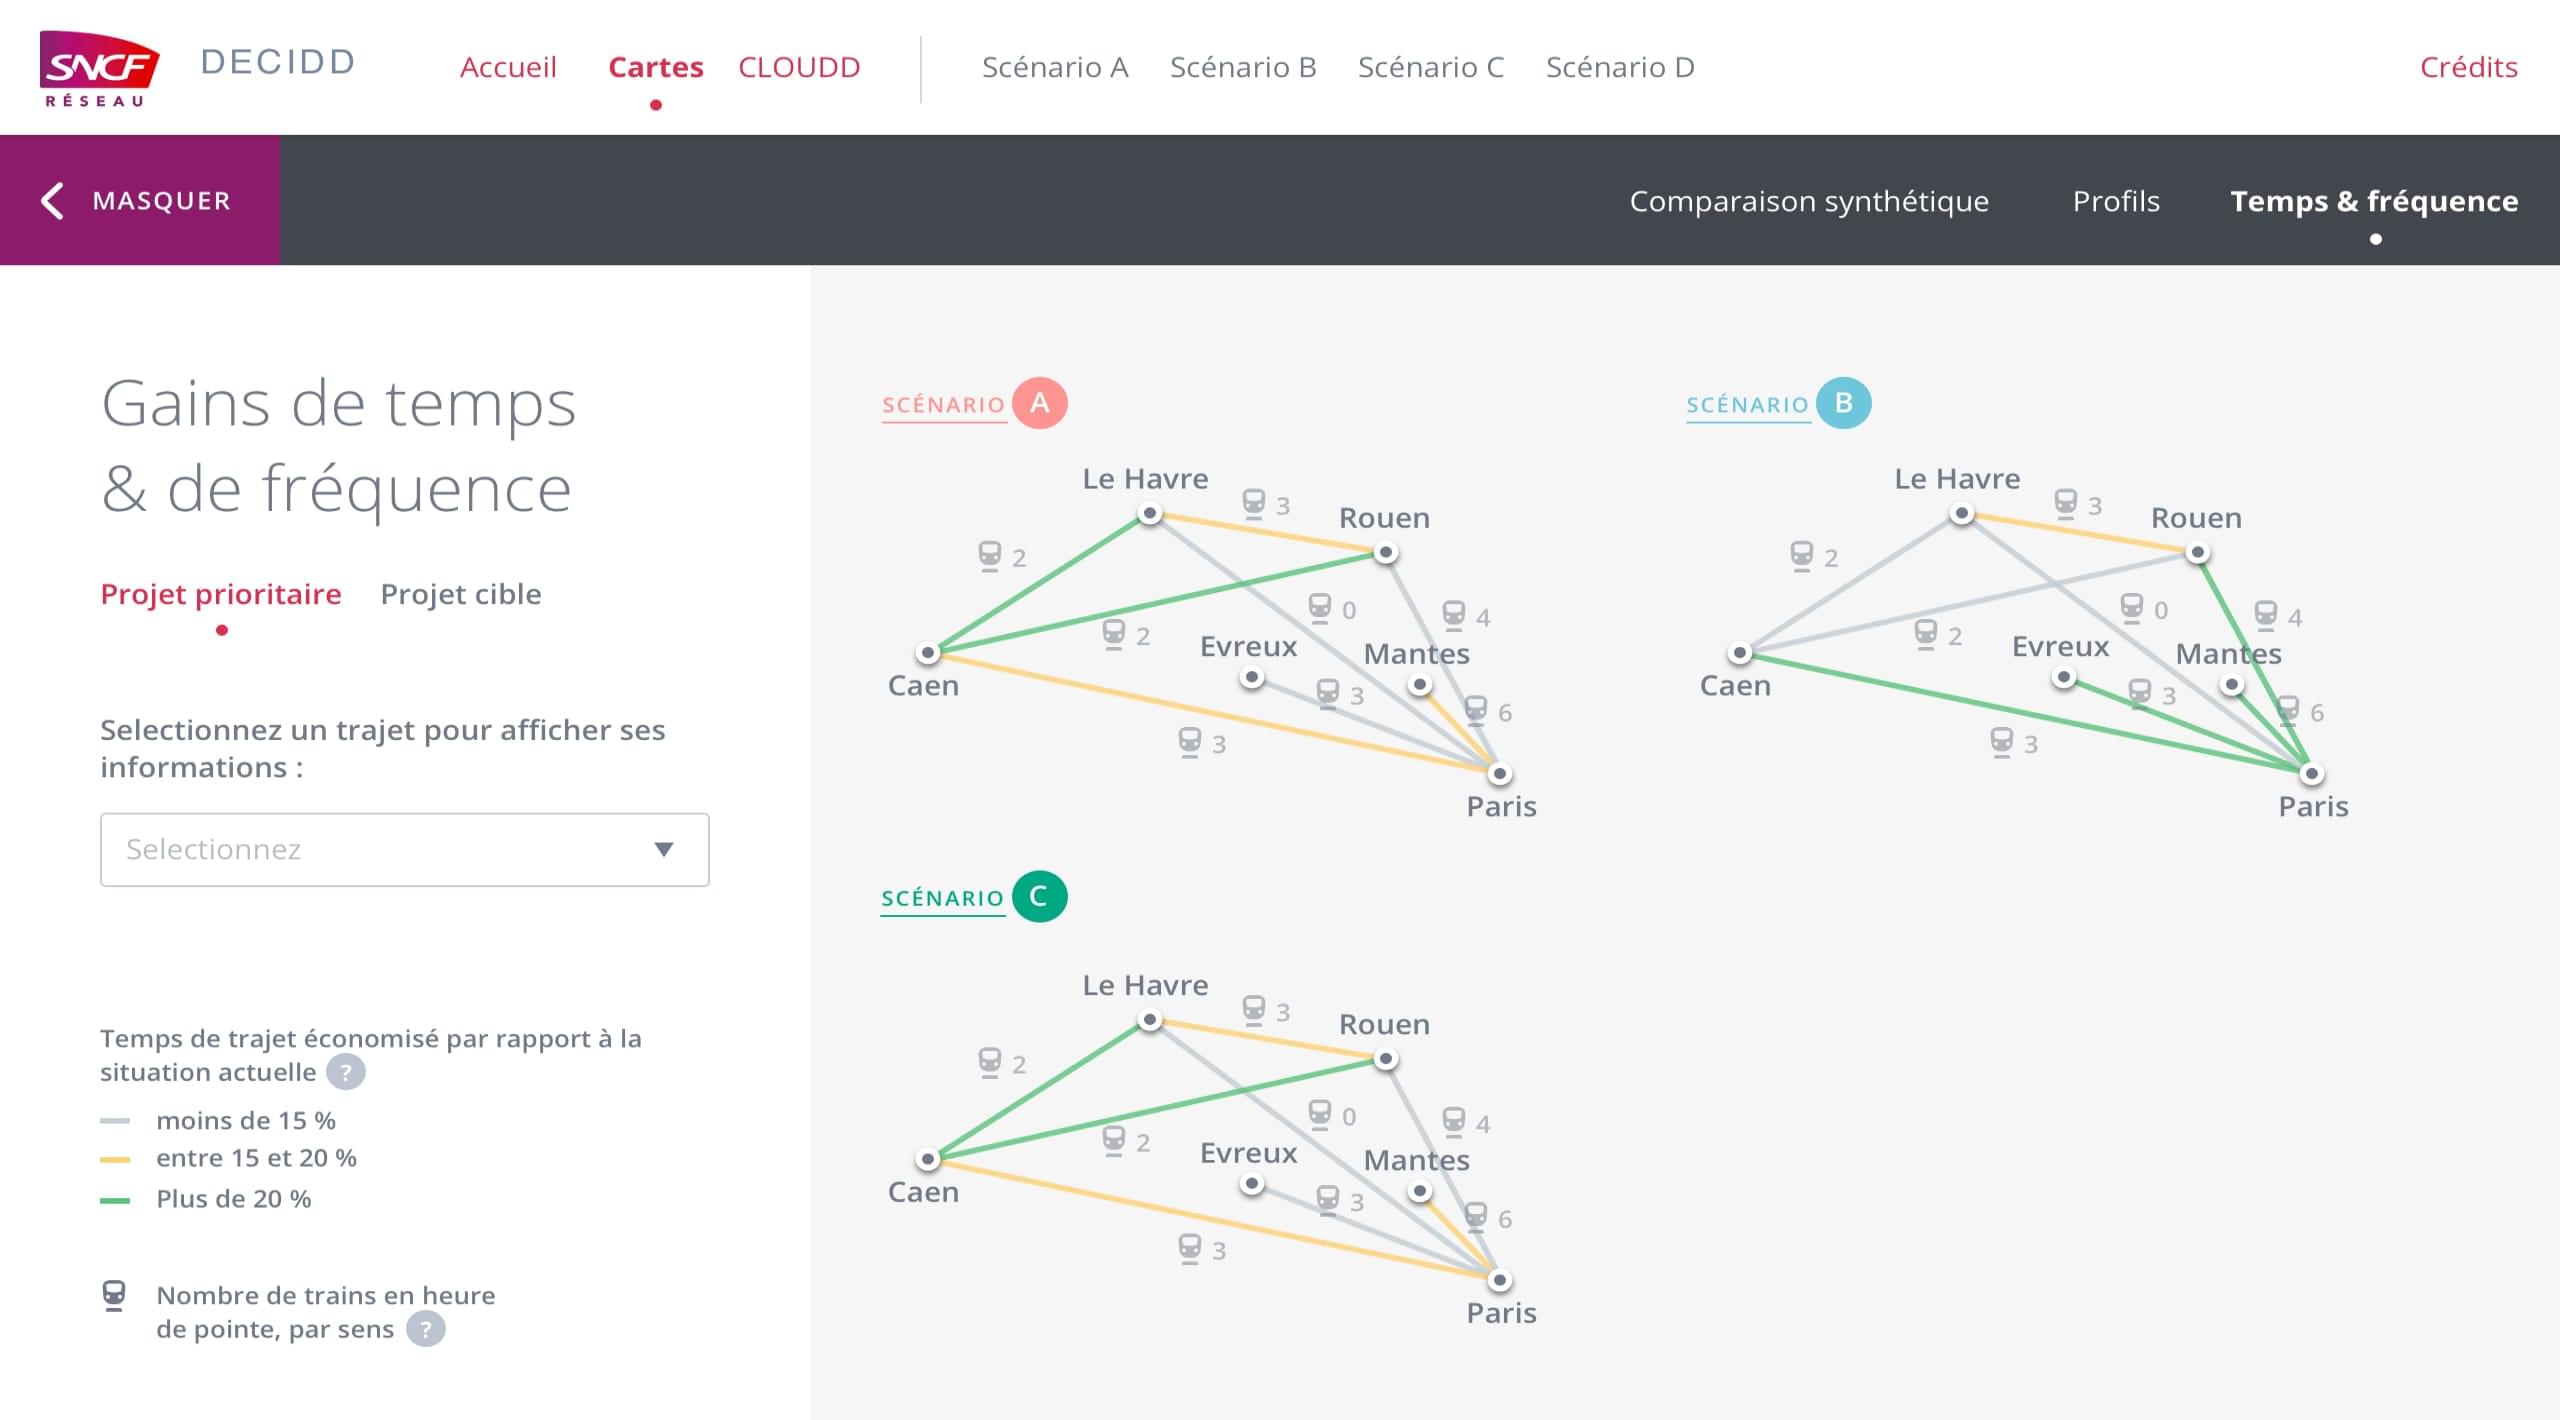
The user can check the strengths and weaknesses of each route—for example, time savings per trip.
Solution
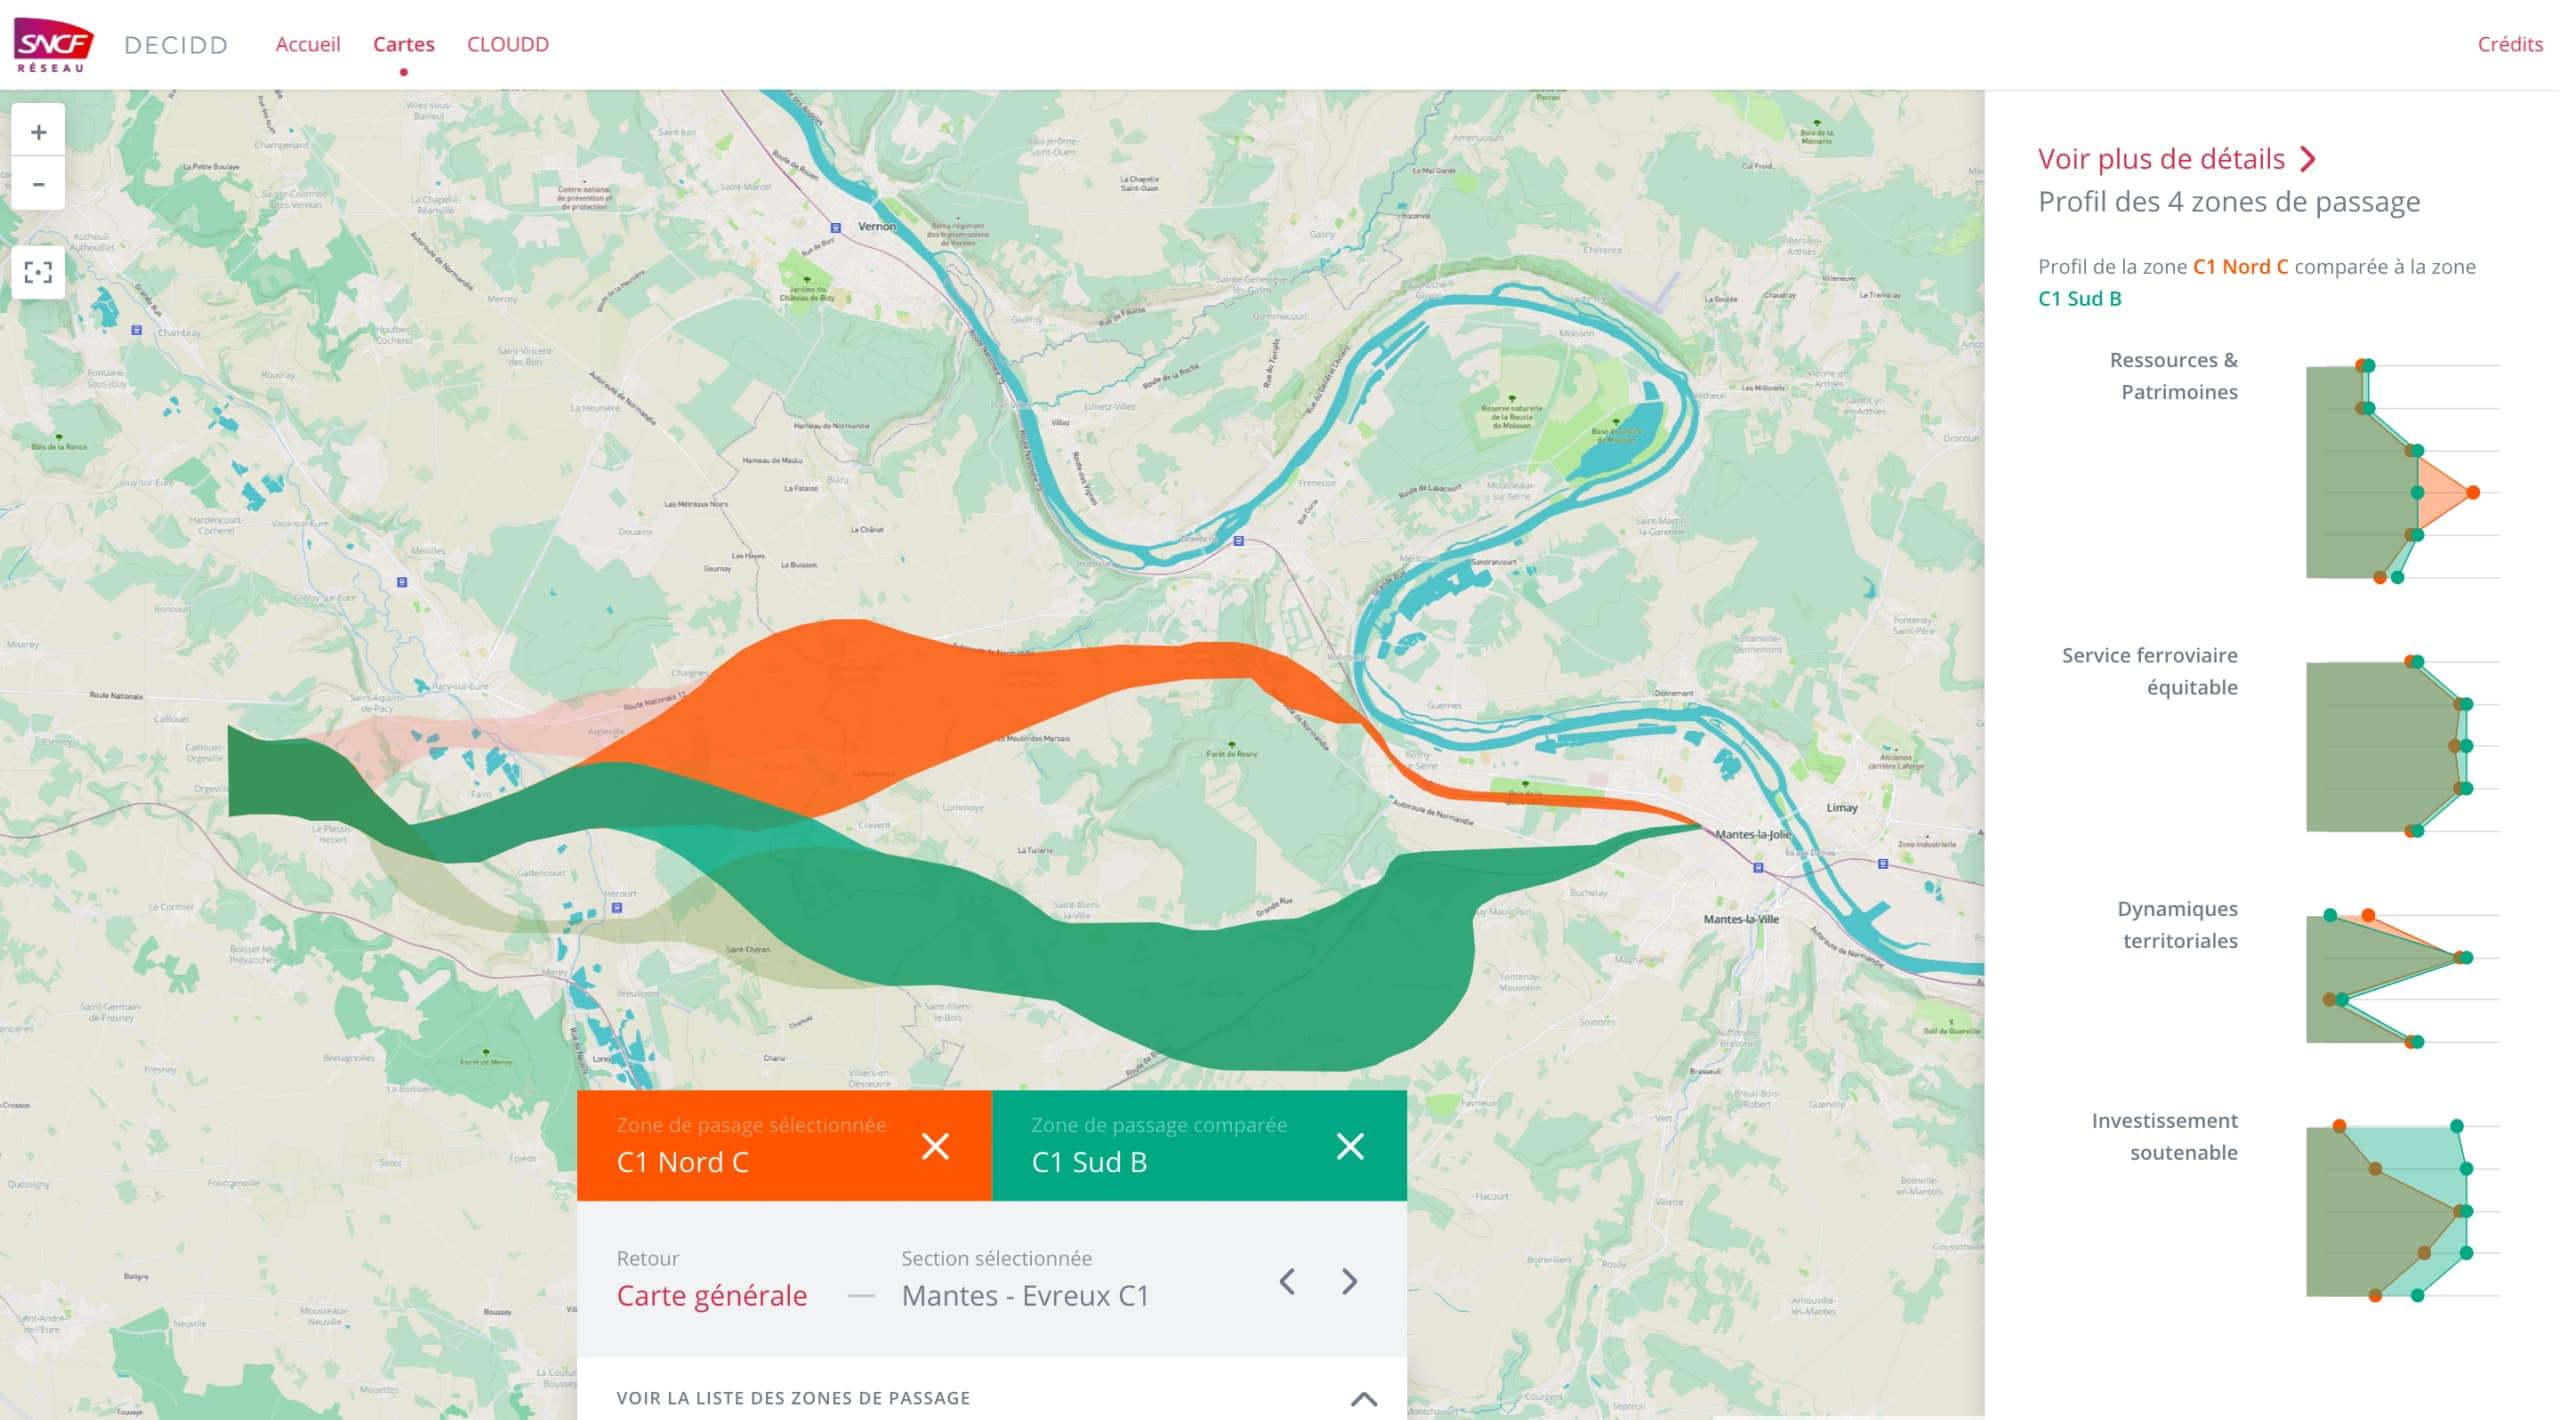
To make comparisons possible, the tool synchronizes a map of the routes with a visualization of the indicators associated with each route. It offers several reading levels for each scenario, from the most aggregated to the most detailed, and facilitates multi-criteria analysis by presenting all the indicators together.
The user can isolate within the system the criteria with values that contrast the most.
Highlight
Visualization is at the heart of SNCF Réseau's approach to transparency. During the consultation, local stakeholders were able to use visualization as a synthesis tool to discuss route options without having to consider all the different evaluation criteria at the same time—the indicators were already compared and presented for them. Once the final route was selected, the tool made it possible to show citizens the criteria that guided the decision, and the comparative advantages of the route chosen compared to the other options.
Subscribe to our newsletter:
75010 Paris
France