Tool
ODSee
Model and visualize millions of public transport journeys to better match transport services with demand.
Client
Groupe RATP
Date
2016 - 6 months
Results
ODsee was used by RATP Dev in Casablanca, Morocco, to optimize transport services during certain periods, such as Ramadan.
In 2016, we worked with the RATP group and IFSTTAR to develop the ODsee tool. ODsee uses large volumes of origin-destination (OD) data to visualize the movements of commuters. It provides transport operators with useful information to better match their services to mobility demand.
Problem
The RATP group wanted to make better use of their large OD (commuter origin-destination) databases in order to improve their methods of devising public transport services. However, the volume of this data made it impossible to analyze without a dedicated and efficient tool. In 2016, there was no ‘off-the-shelf’ tool that could process such large volumes of data while also meeting the specific challenges of the public transport world. To address this, the RATP group worked with Dataveyes and IFSTTAR to create the ODsee tool.
We optimized the user experience to make it more possible to discover new information and to give users increased flexibility in terms of data mining.
Data
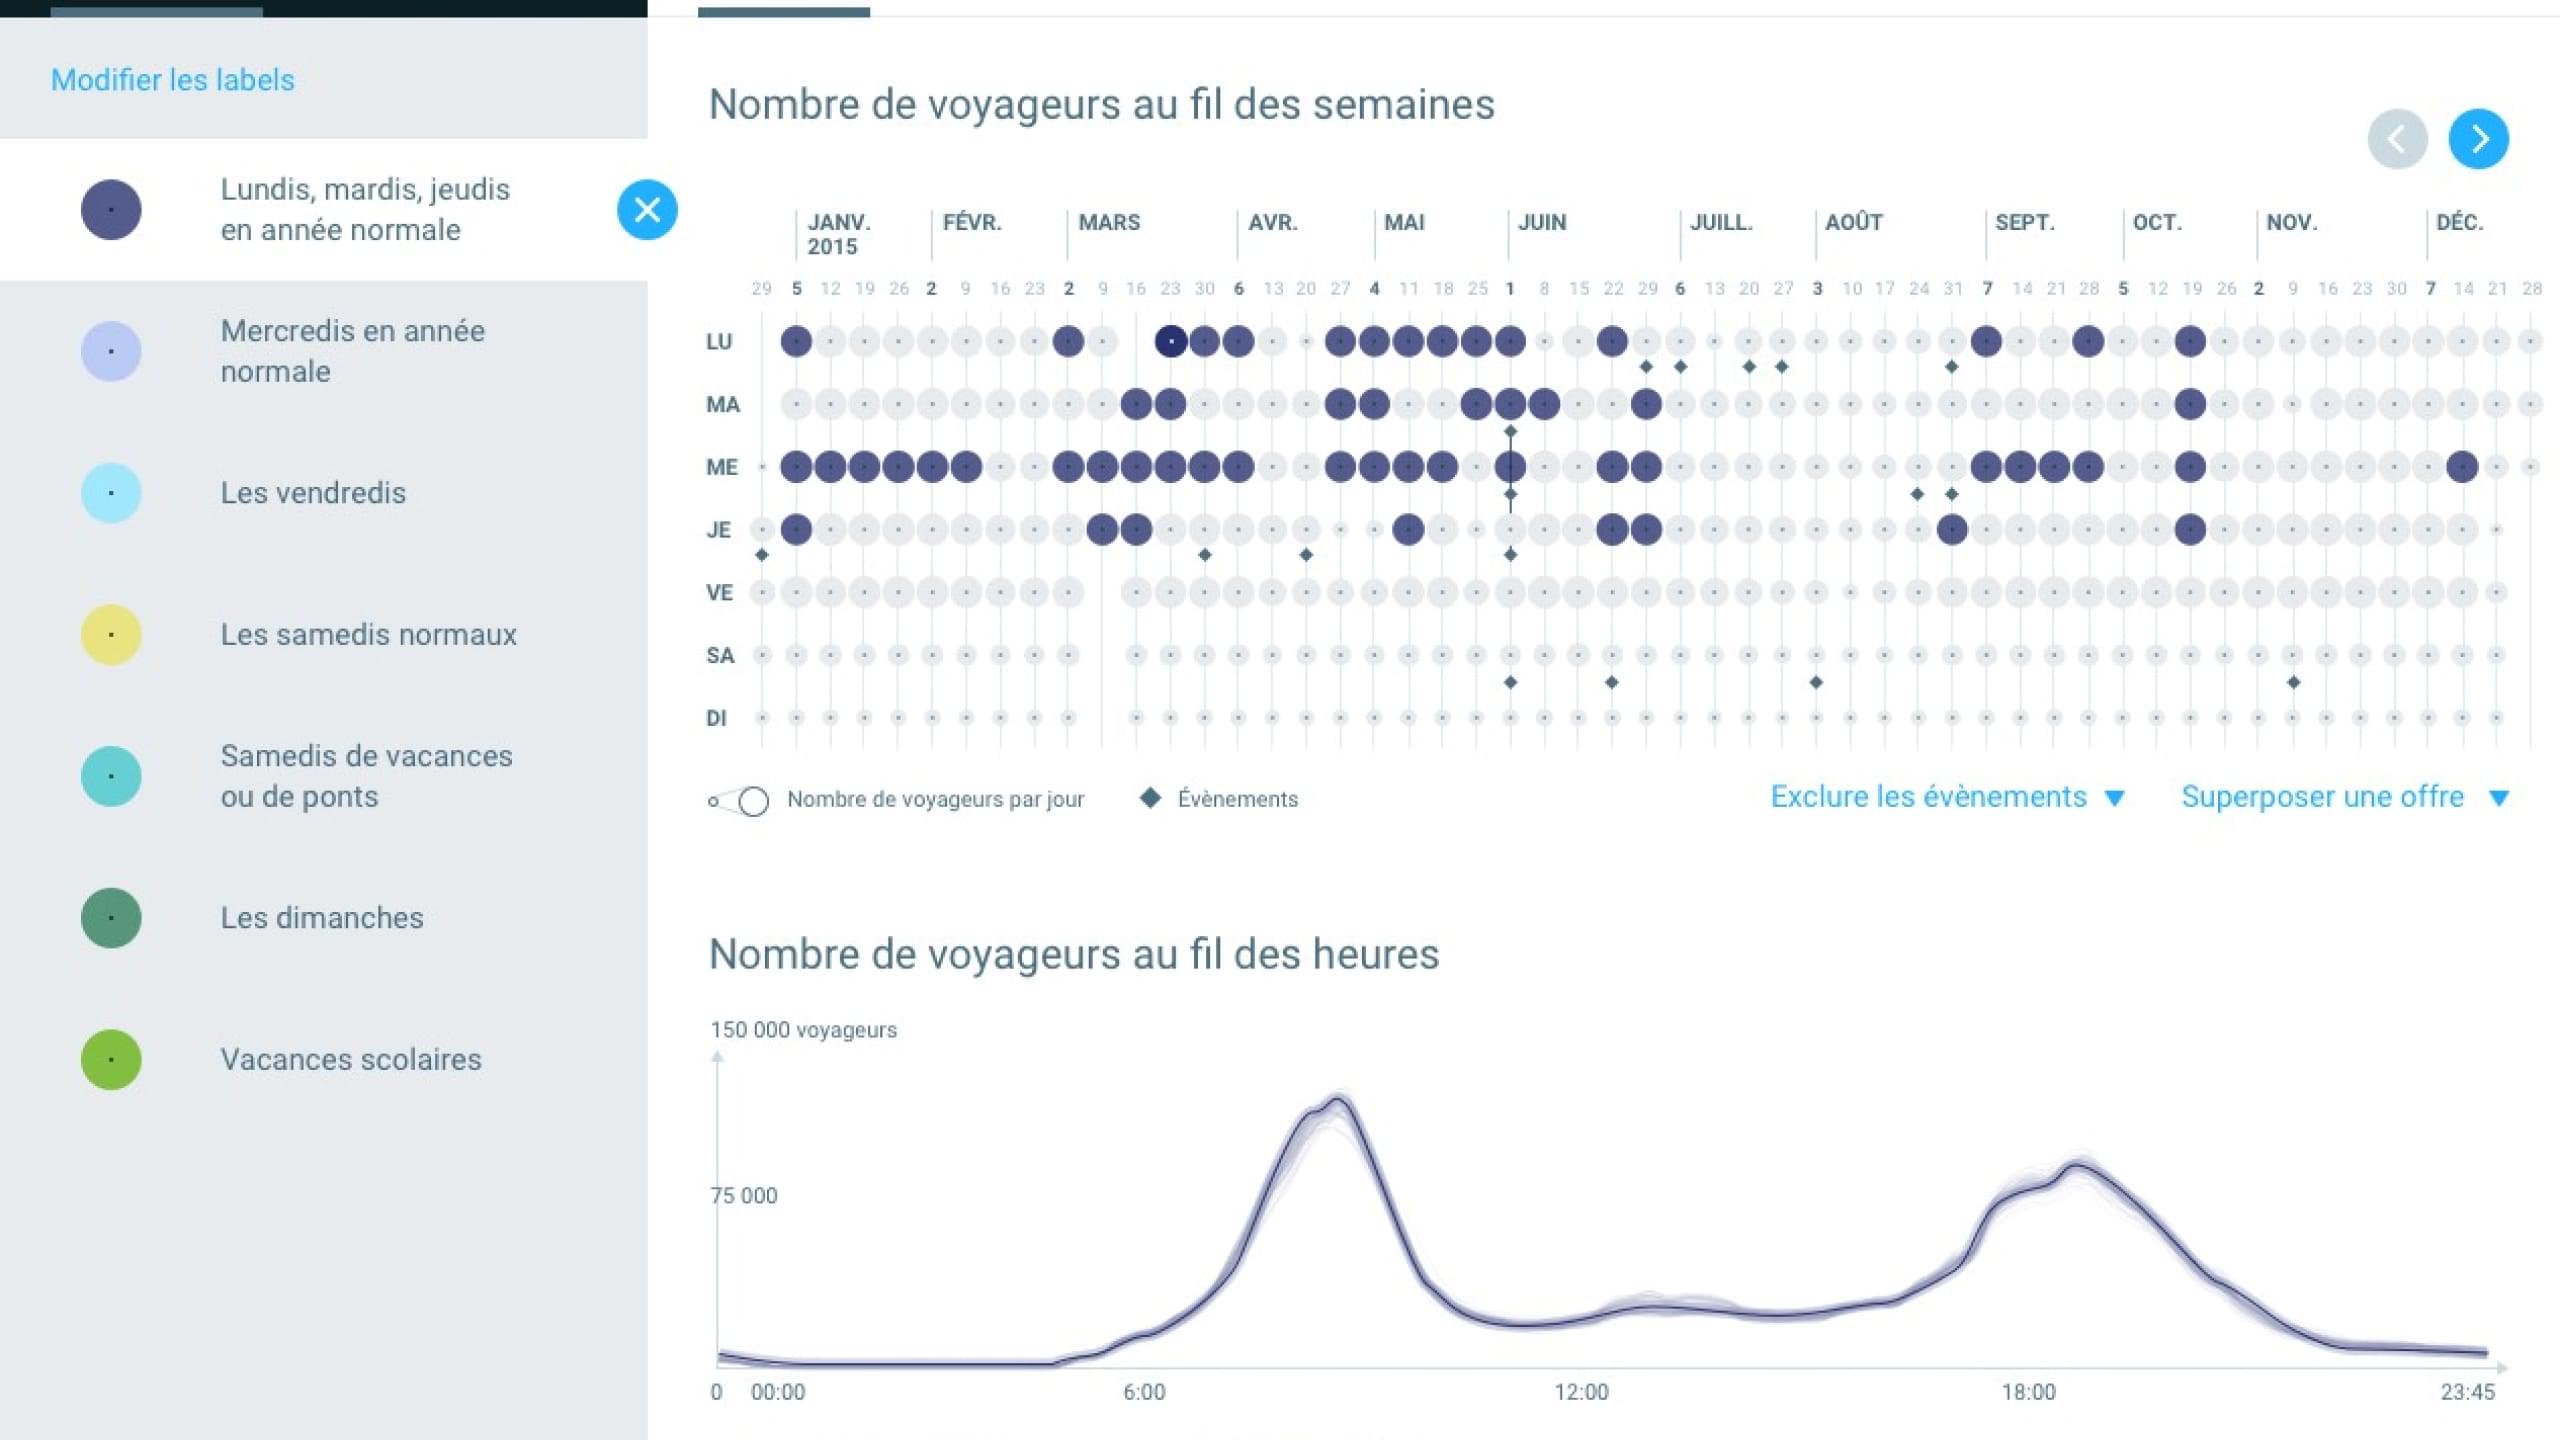
OD data describes how many people travel between an origin station (O) and a destination station (D) on a transport network. It also describes how many people travelled between a given pair of stations every 15 minutes over a period of several years. These datasets represent several tens of millions of lines per year. They are usually collected continuously on transport networks where passengers validate their entries and exits with magnetic cards. To be properly analyzed, this data was enriched with data that describes the structure of the network, existing transport services, or significant public events.
Method
We analyzed new information from the OD data and identified ways in which this information was useful for public transport operators. We carried out interviews with representatives of different departments and also studied how improved use of OD data could help solve problems or make certain tasks easier. We then conducted workshops to prioritize features and information, which allowed us to achieve consistent user journeys in terms of the work habits of targeted users. From the first prototype, we carried out tests to ensure users were engaging with the tool correctly.
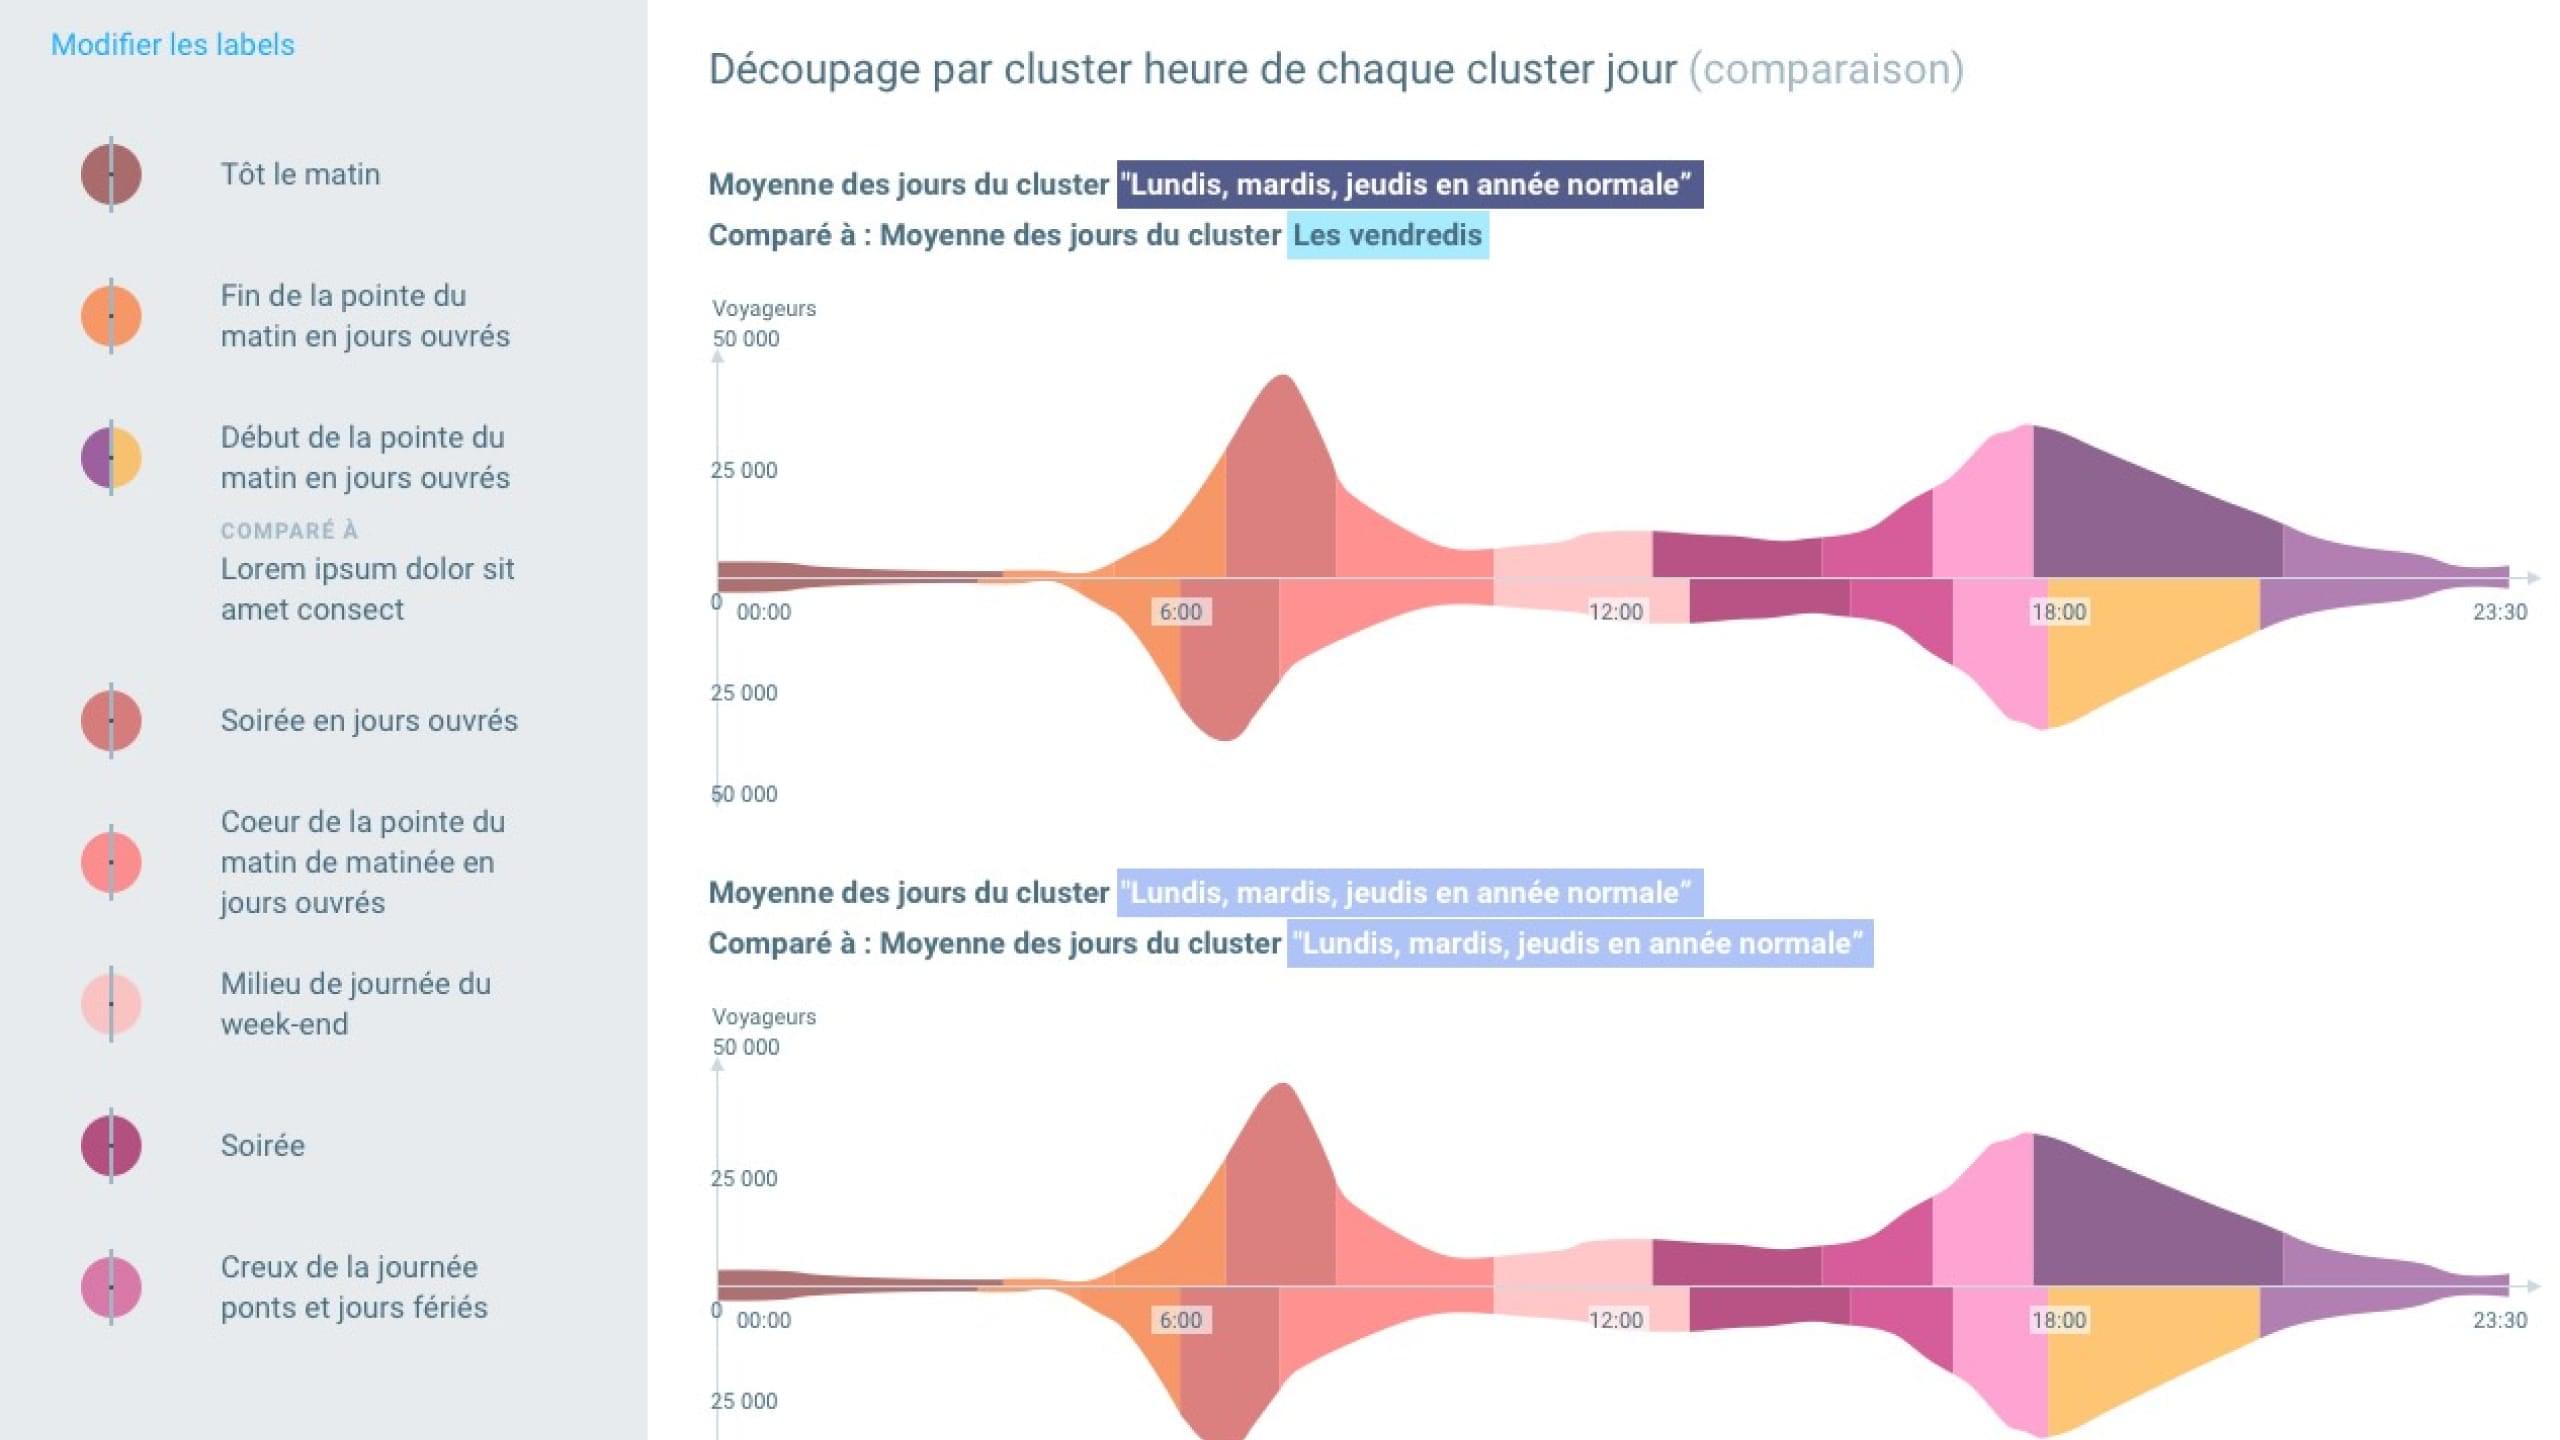
We created new methods of data visualization, in particular a new way of constructing load capacity graphs that are better adapted to the transport world. We visualized the load—the number of travelers—moving between stations rather than the number of people actually at each station to better reflect passenger flows.
Solution
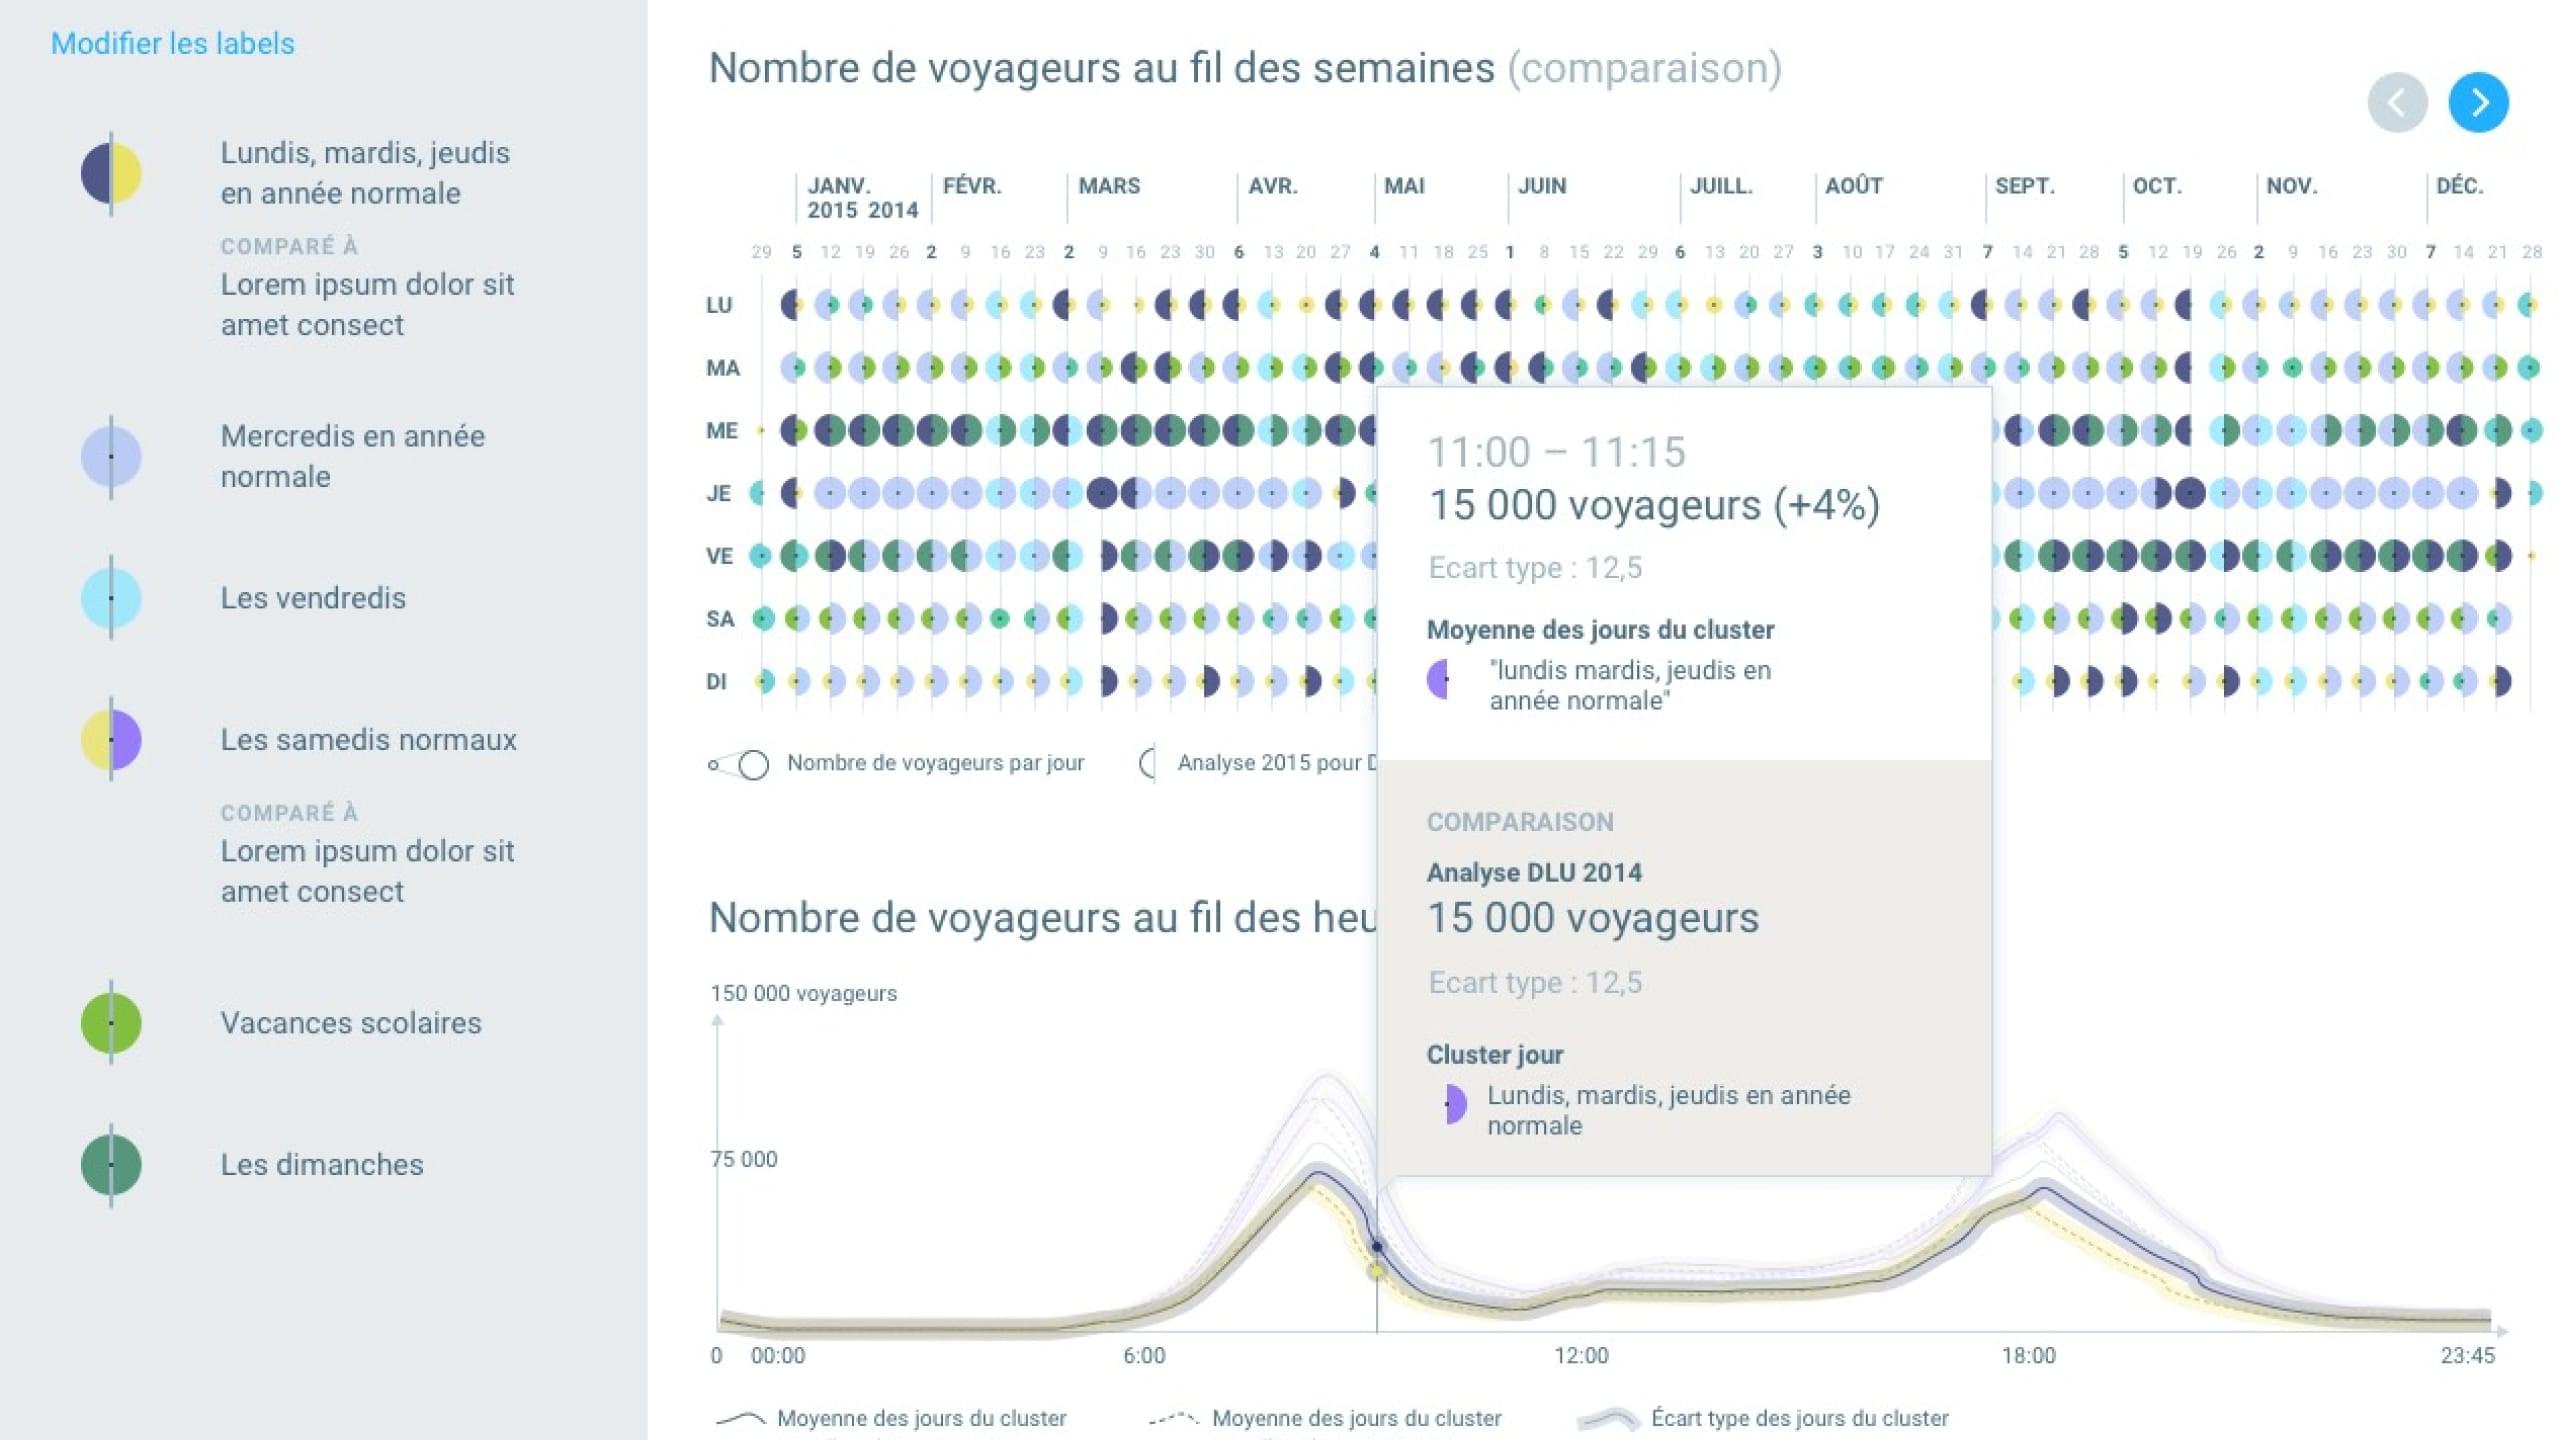
We designed and developed the ODsee tool for use by all levels of staff involved in the operation and planning of transport networks regardless of their technical skills. The visual and user-friendly interface, along with the data visualization itself, makes accessing the data in all its depth easier, and provides fresh insights into new information.
Highlight
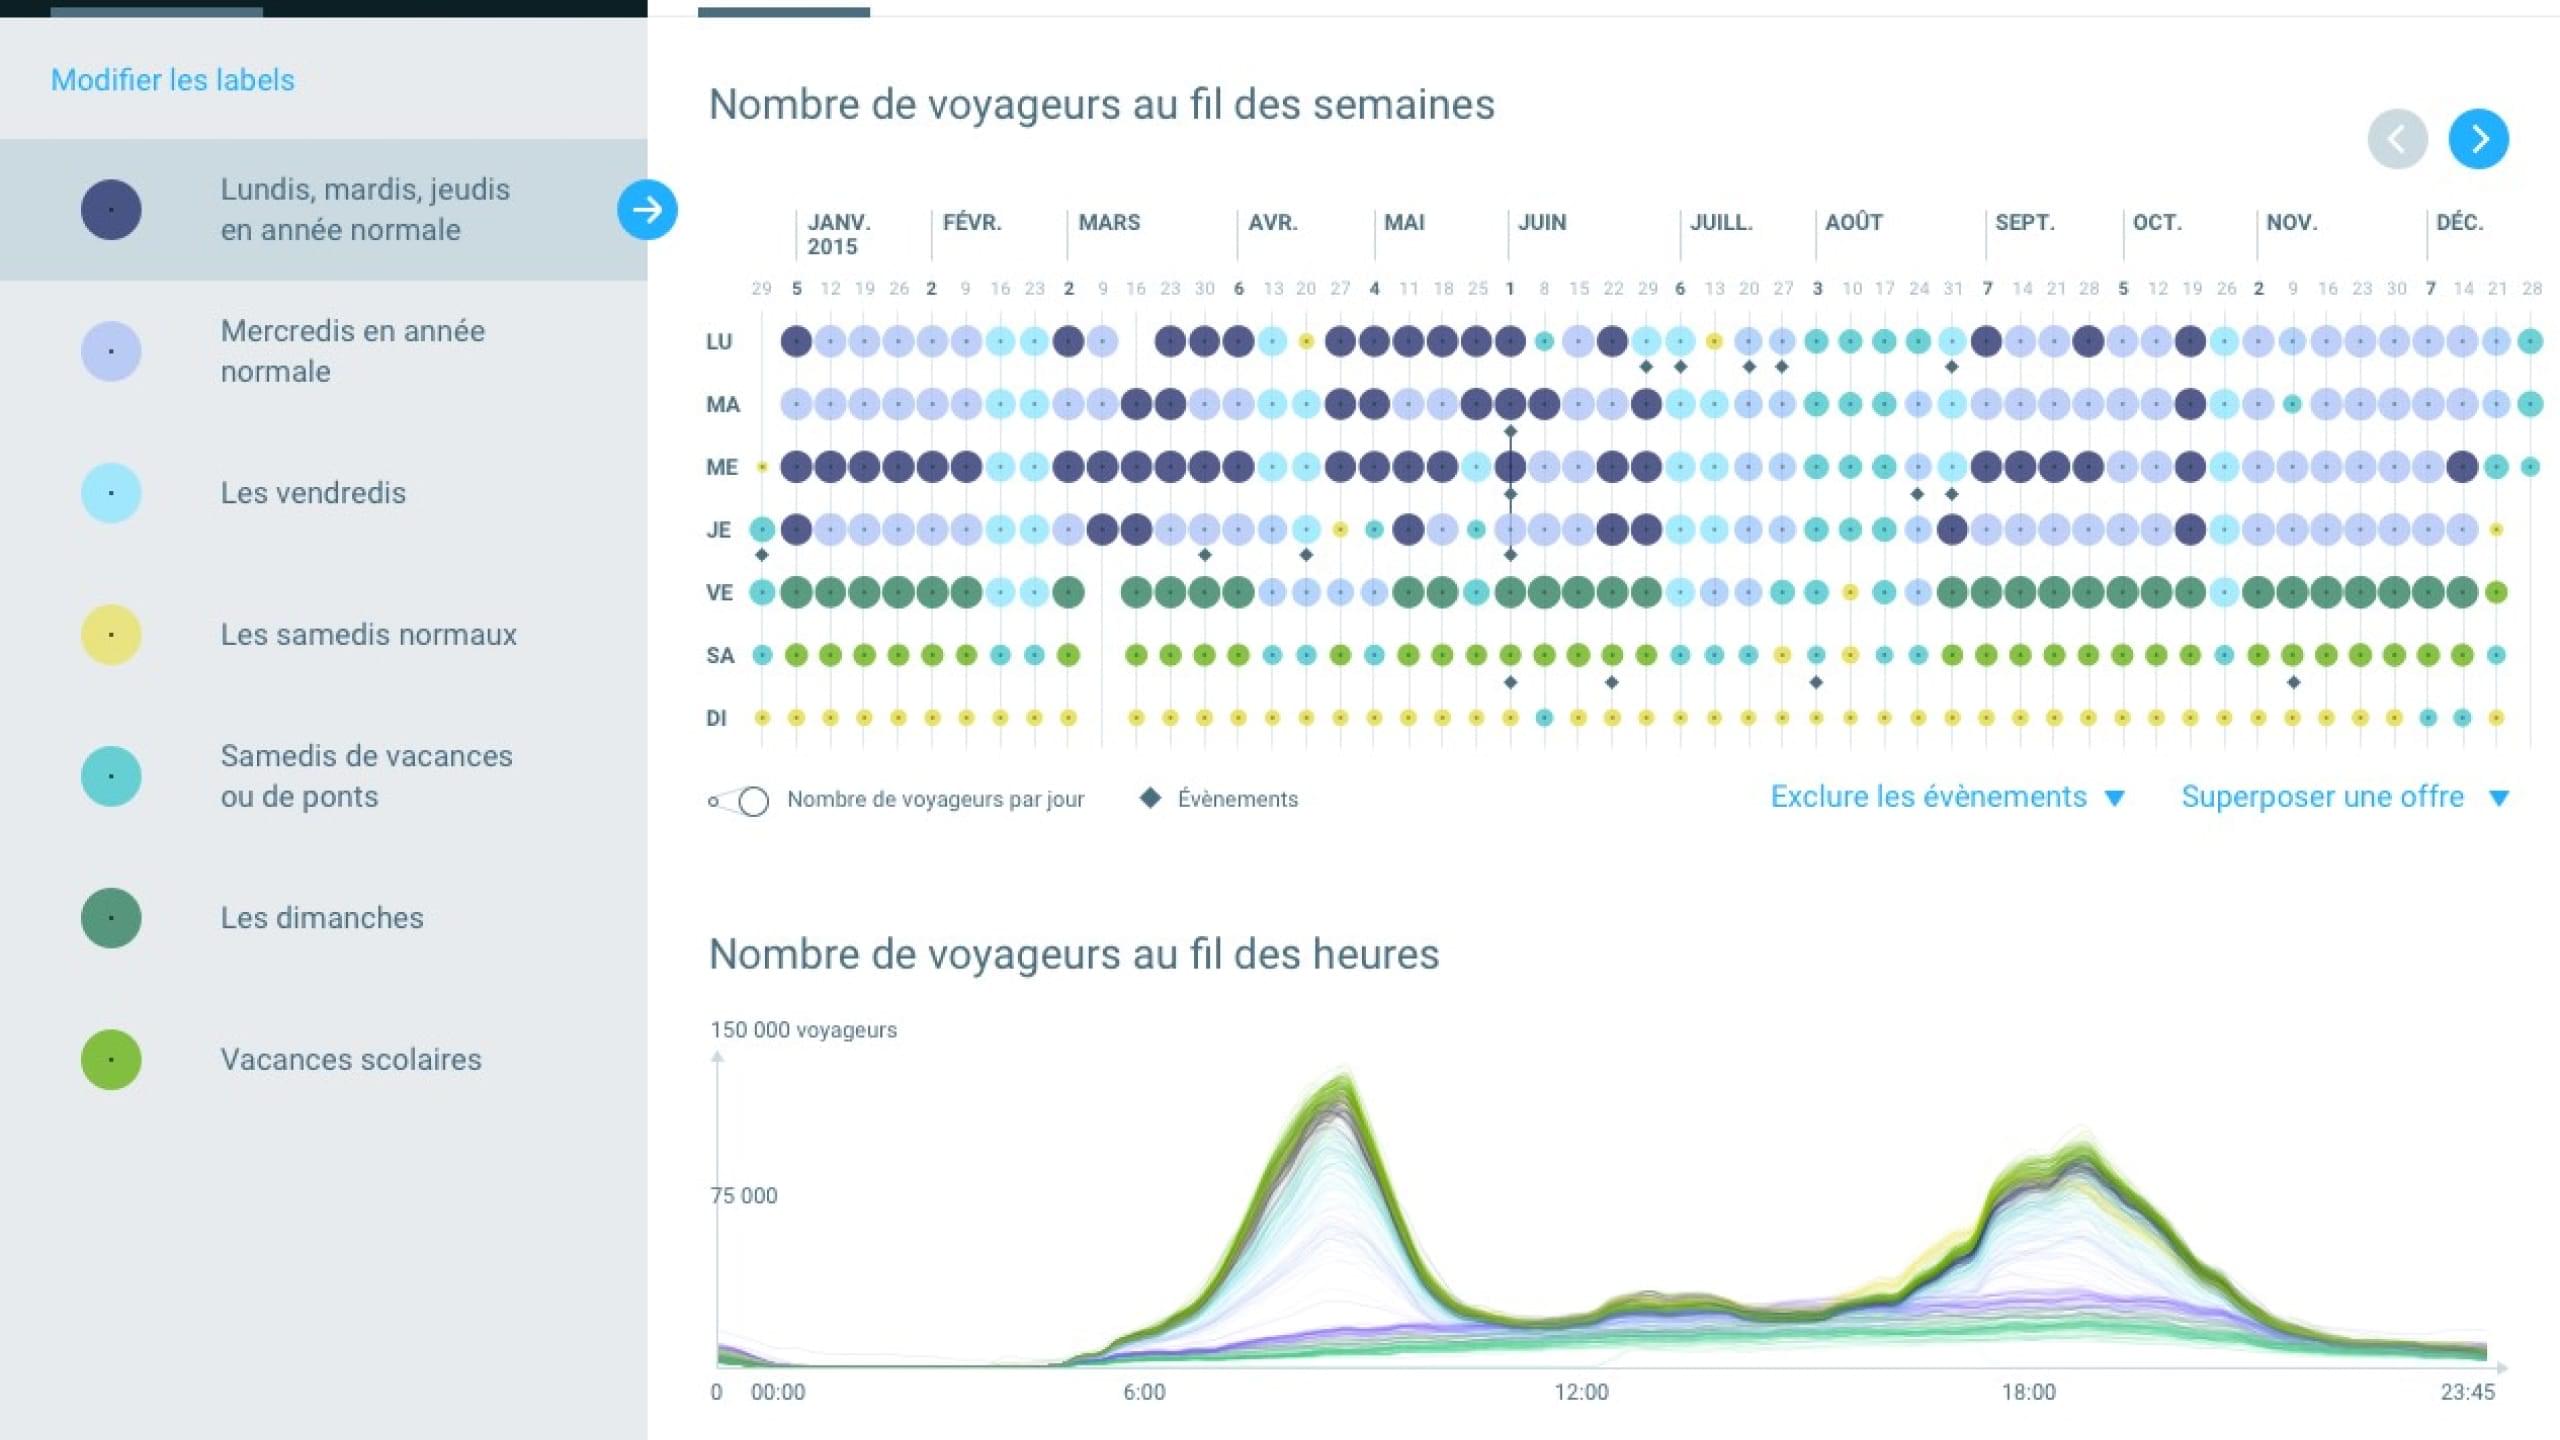
The ODsee tool describes in great detail the demand for mobility, providing strategic information to public transport operators to help them adapt their services to demand. In addition to improving the understanding of transport areas and commuter lifestyles, the tool is also used to make investment and spatial planning decisions.
We designed ODsee to respond to the heavy constraints that large volumes of data impose. The tool is based on multi-server architecture with asynchronous task management to safeguard scalability and performance.
Subscribe to our newsletter:
75010 Paris
France