Application
Mapping consumer data
Make internal teams aware of the importance of data analysis.
Client
Carrefour
Date
2017 - 4 months
We created a data storytelling application for the Carrefour group’s store managers to highlight the importance of using social data. By combining consumer data, Google Trends data and data based on Twitter trends, we produced new insights into the anchoring of local products.
Problem
The Carrefour Data team wanted to produce an enlightening data visualization application to encourage store managers to make better use of data. The first challenge: to prove that new business information can be gleaned from the analysis of social media data.
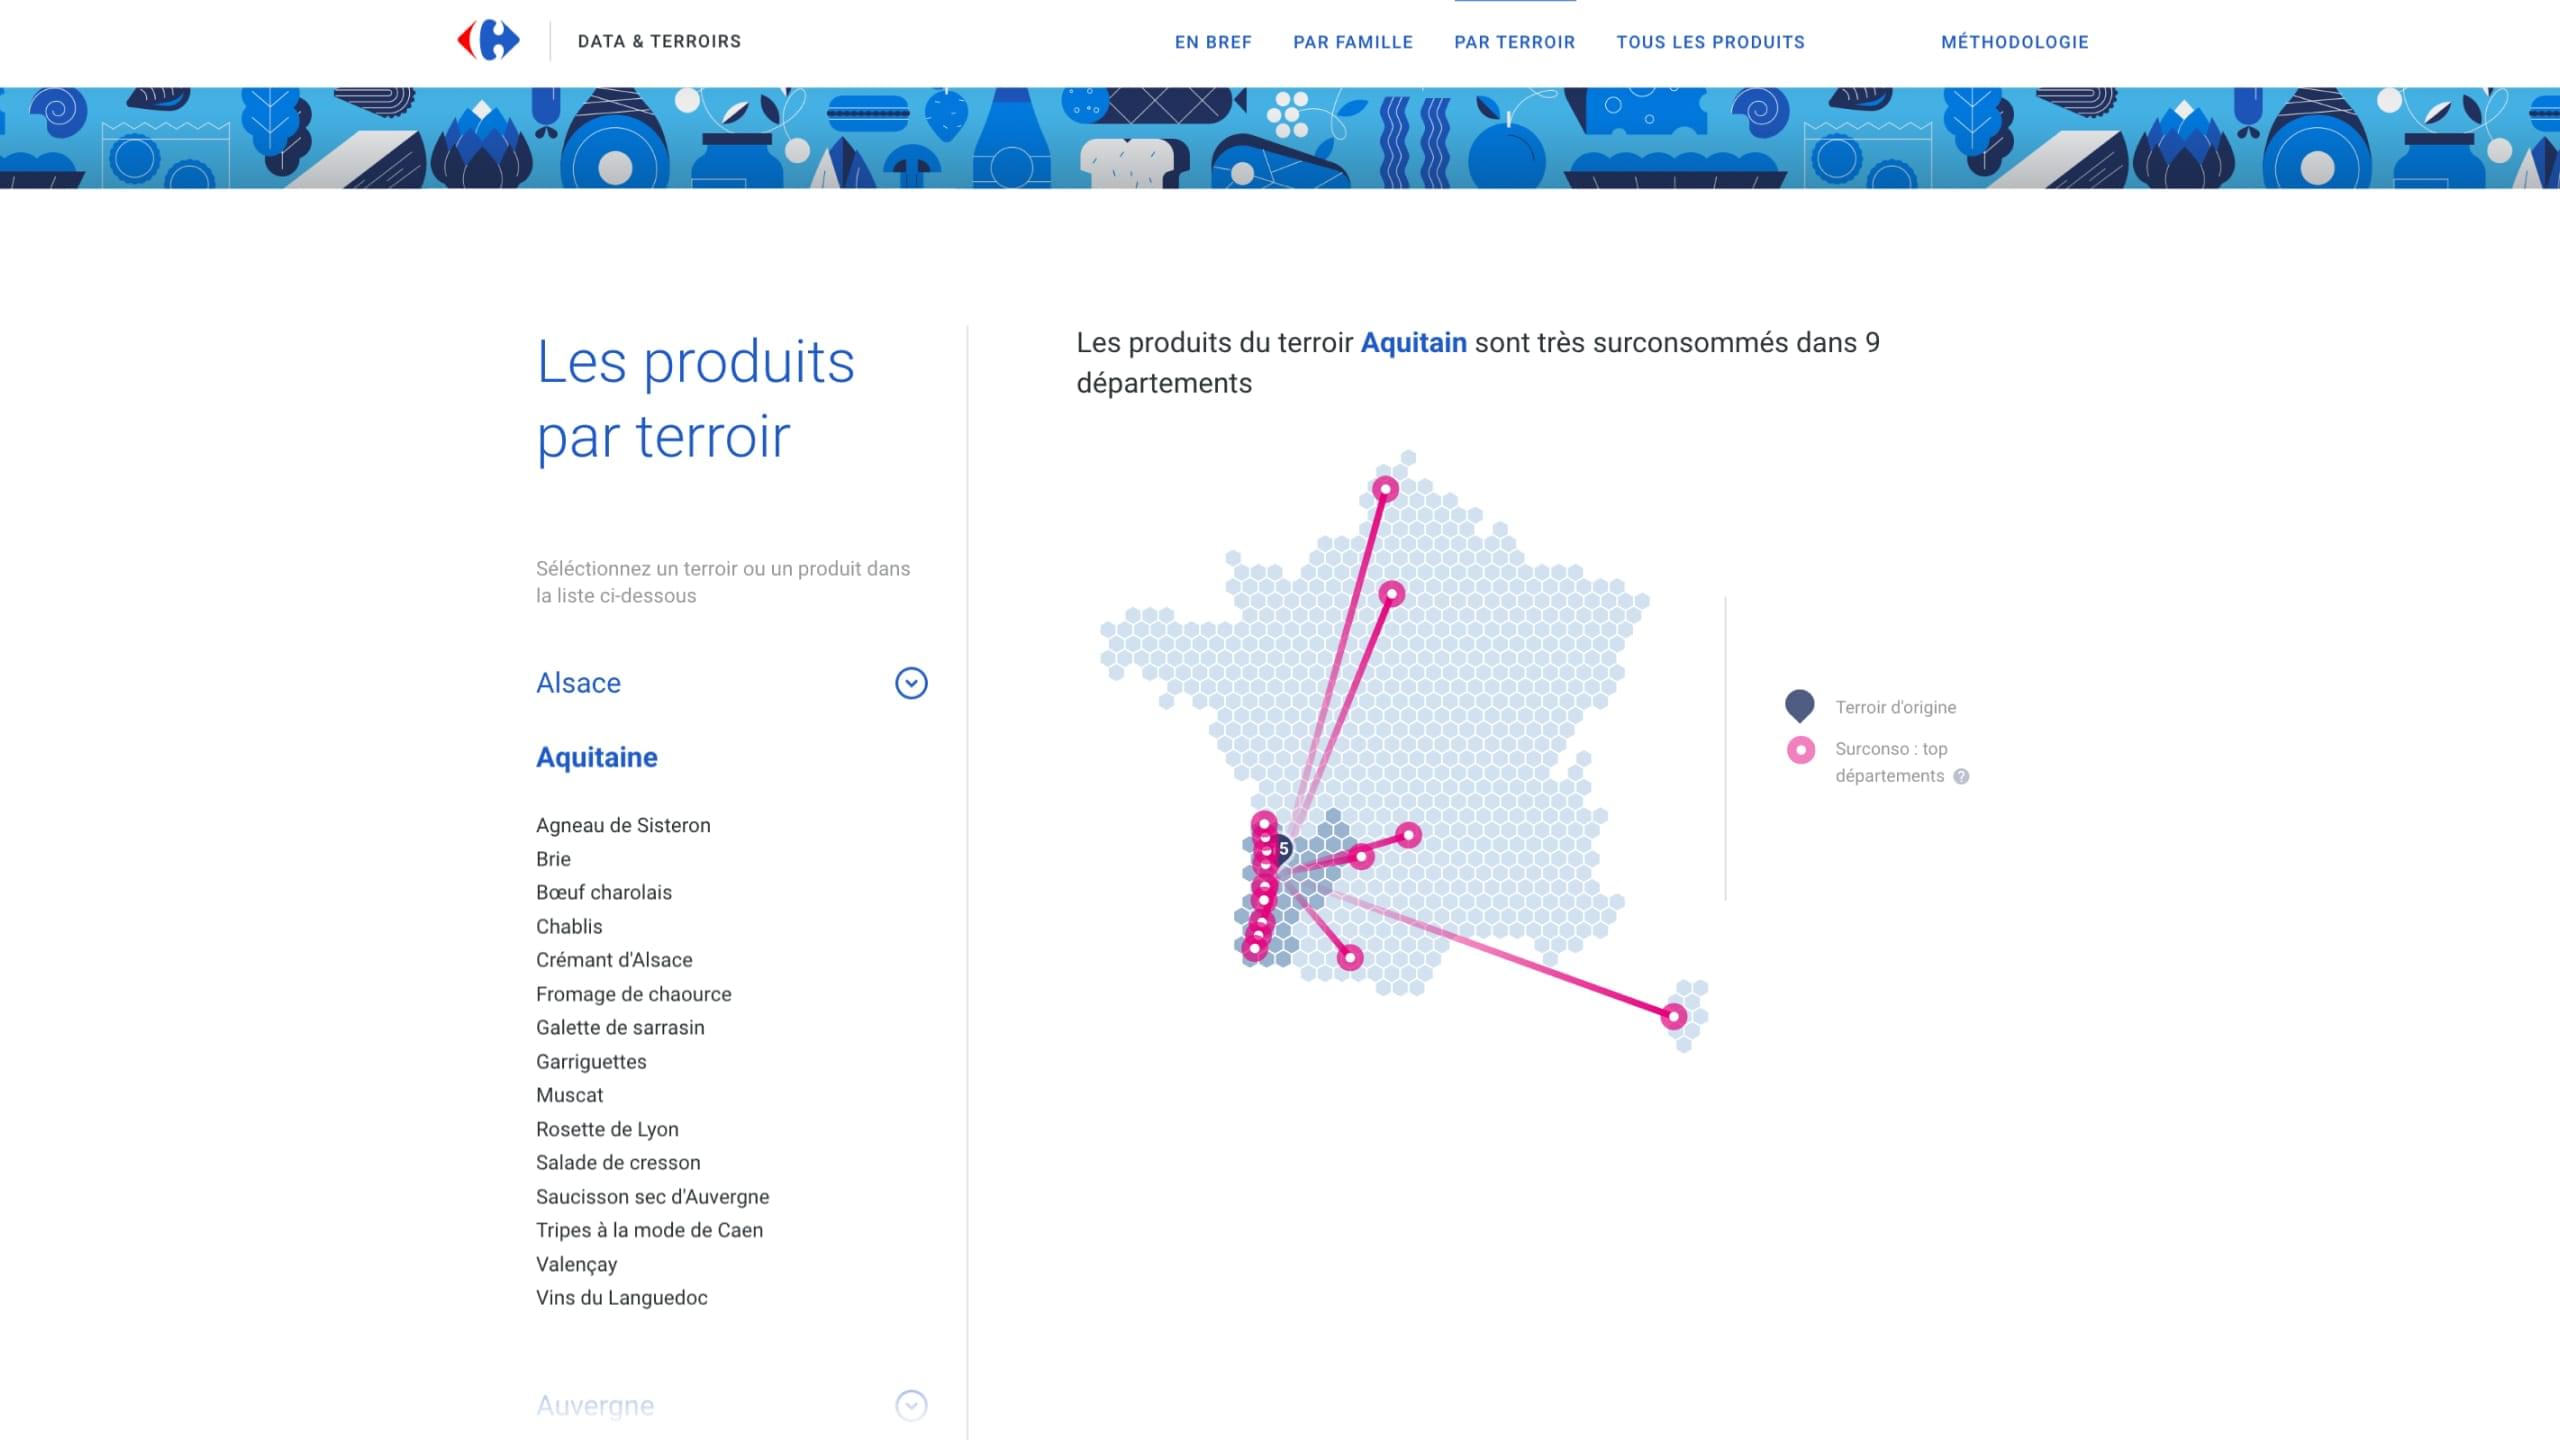
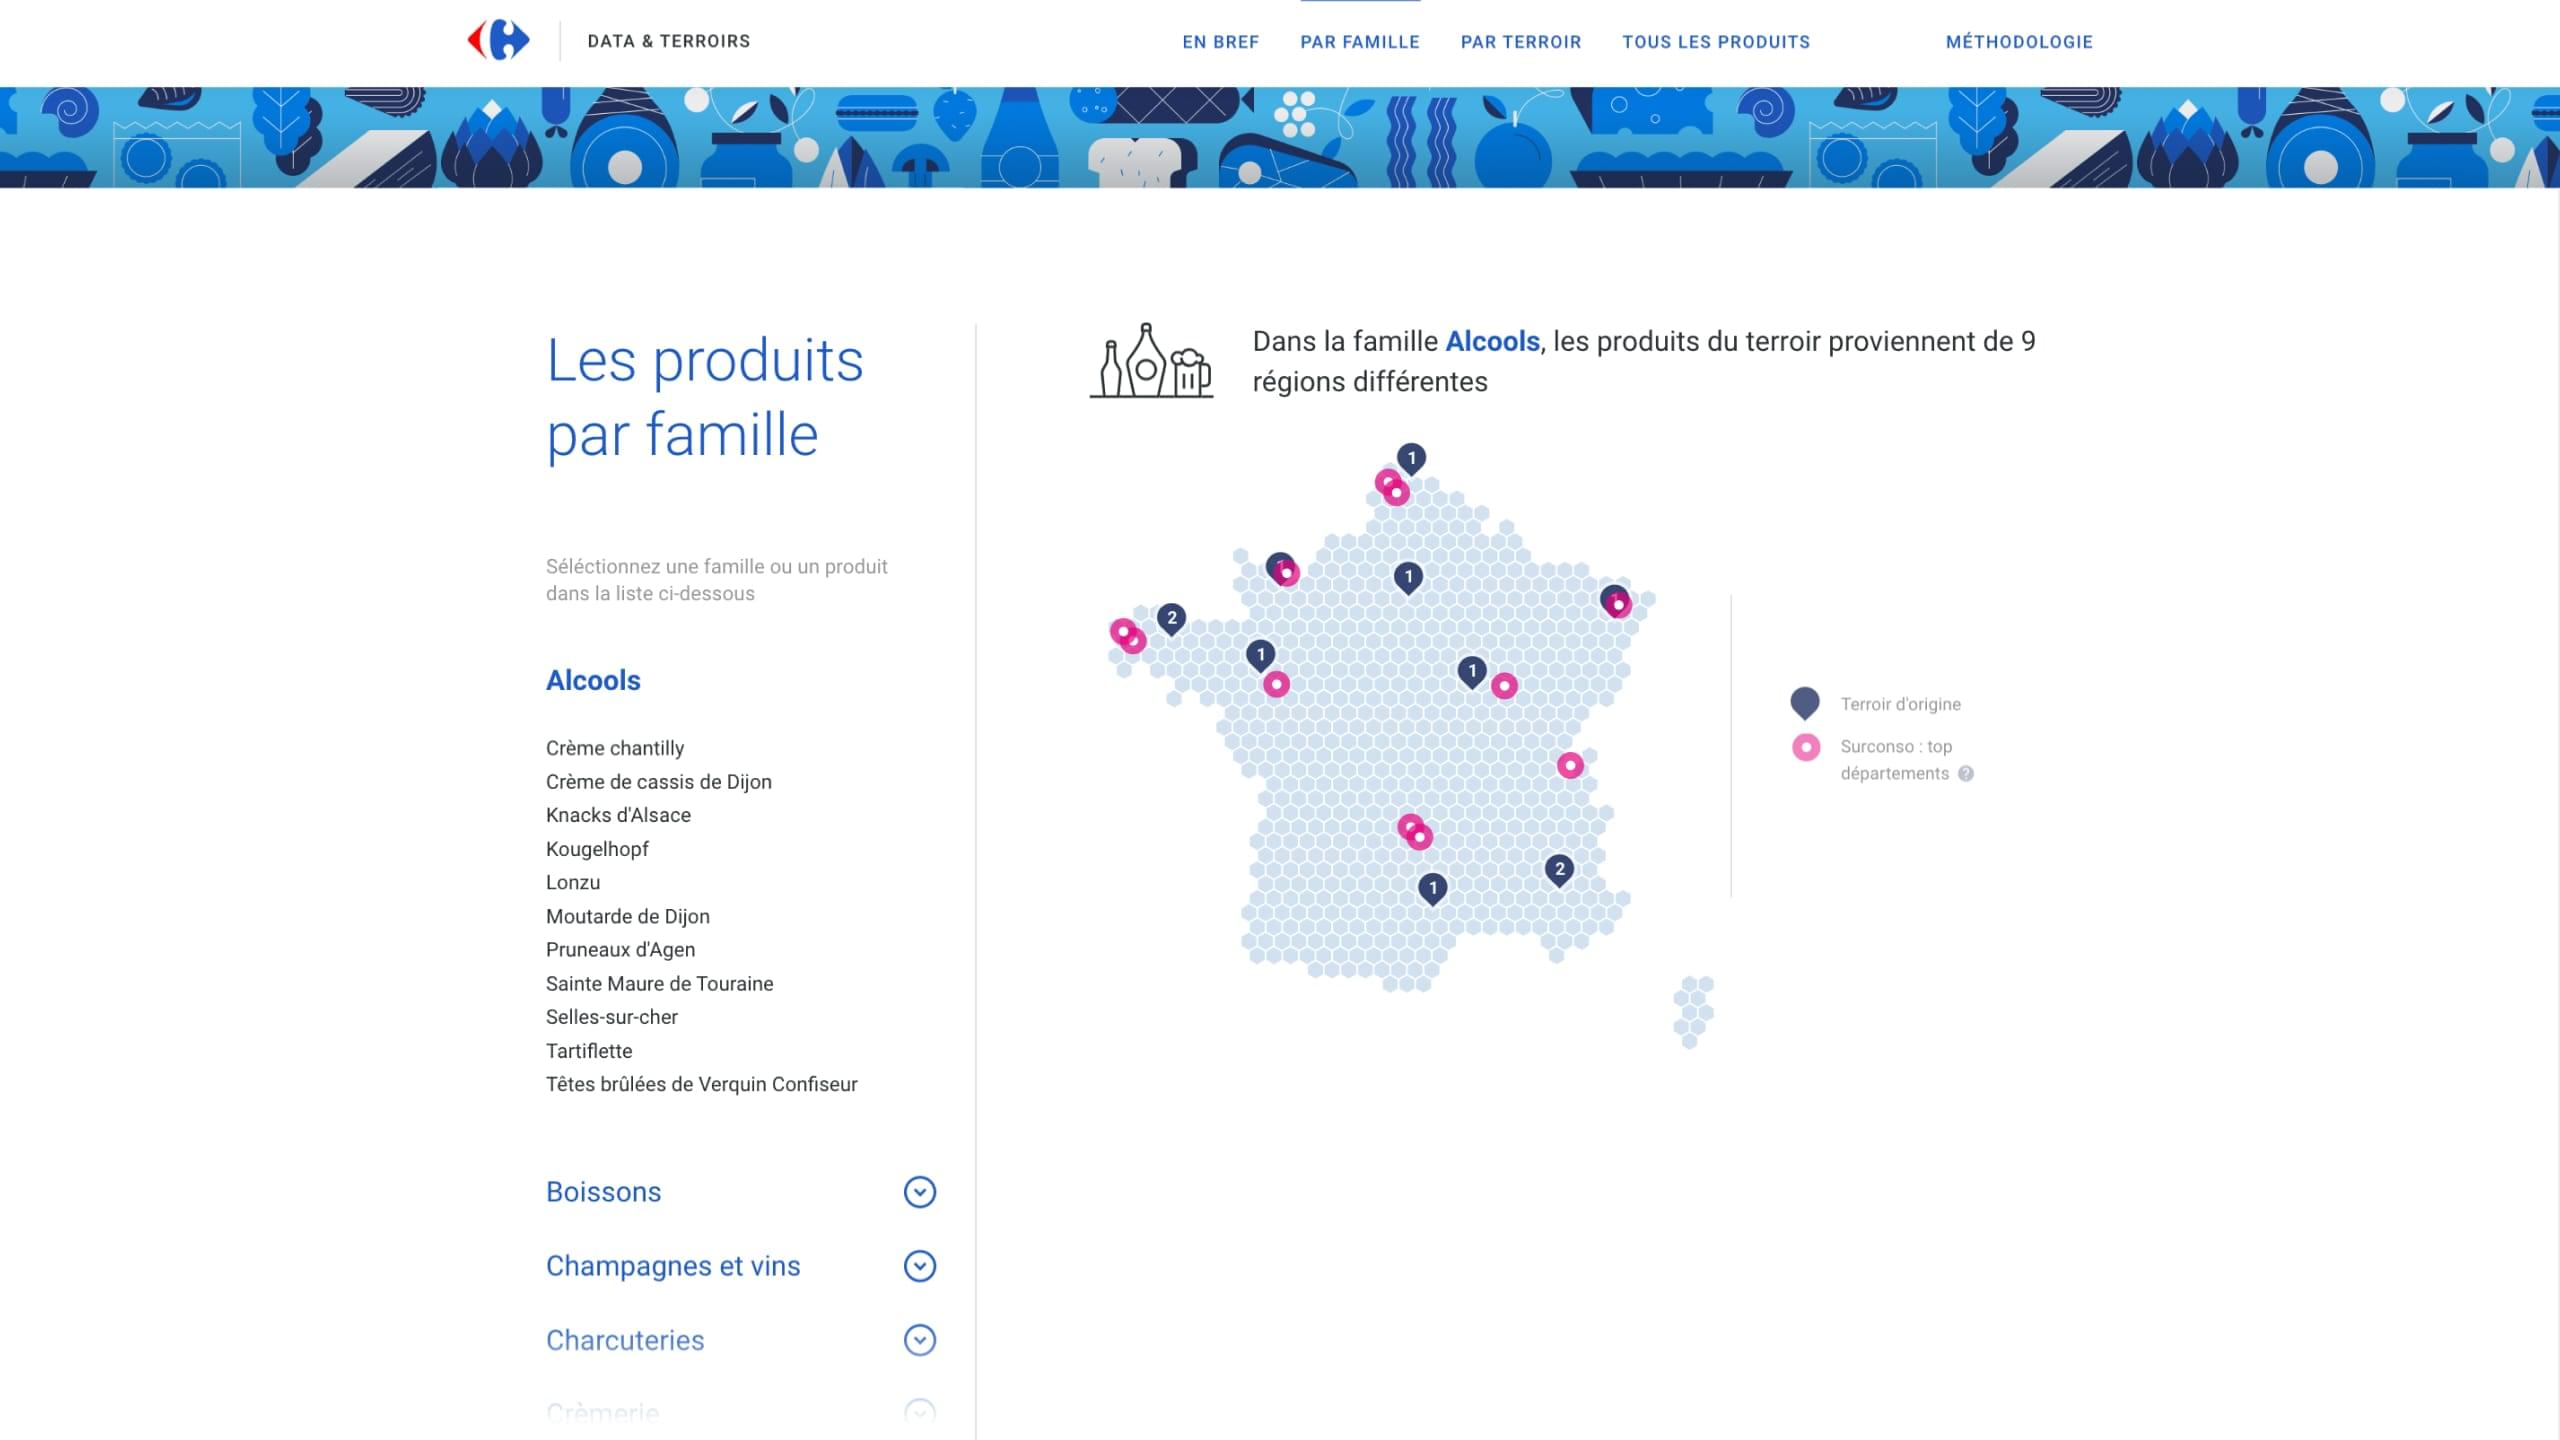
The application helps users compare the local dynamics of a selection of local products.
Data
Three sources of data were used. Firstly, we collected consumer data from a selection of local products sold in-store. Secondly, we compiled Google Trends data that described the search volumes for these products online. We then collated data relating to the number of Twitter and Instagram mentions for these local products.
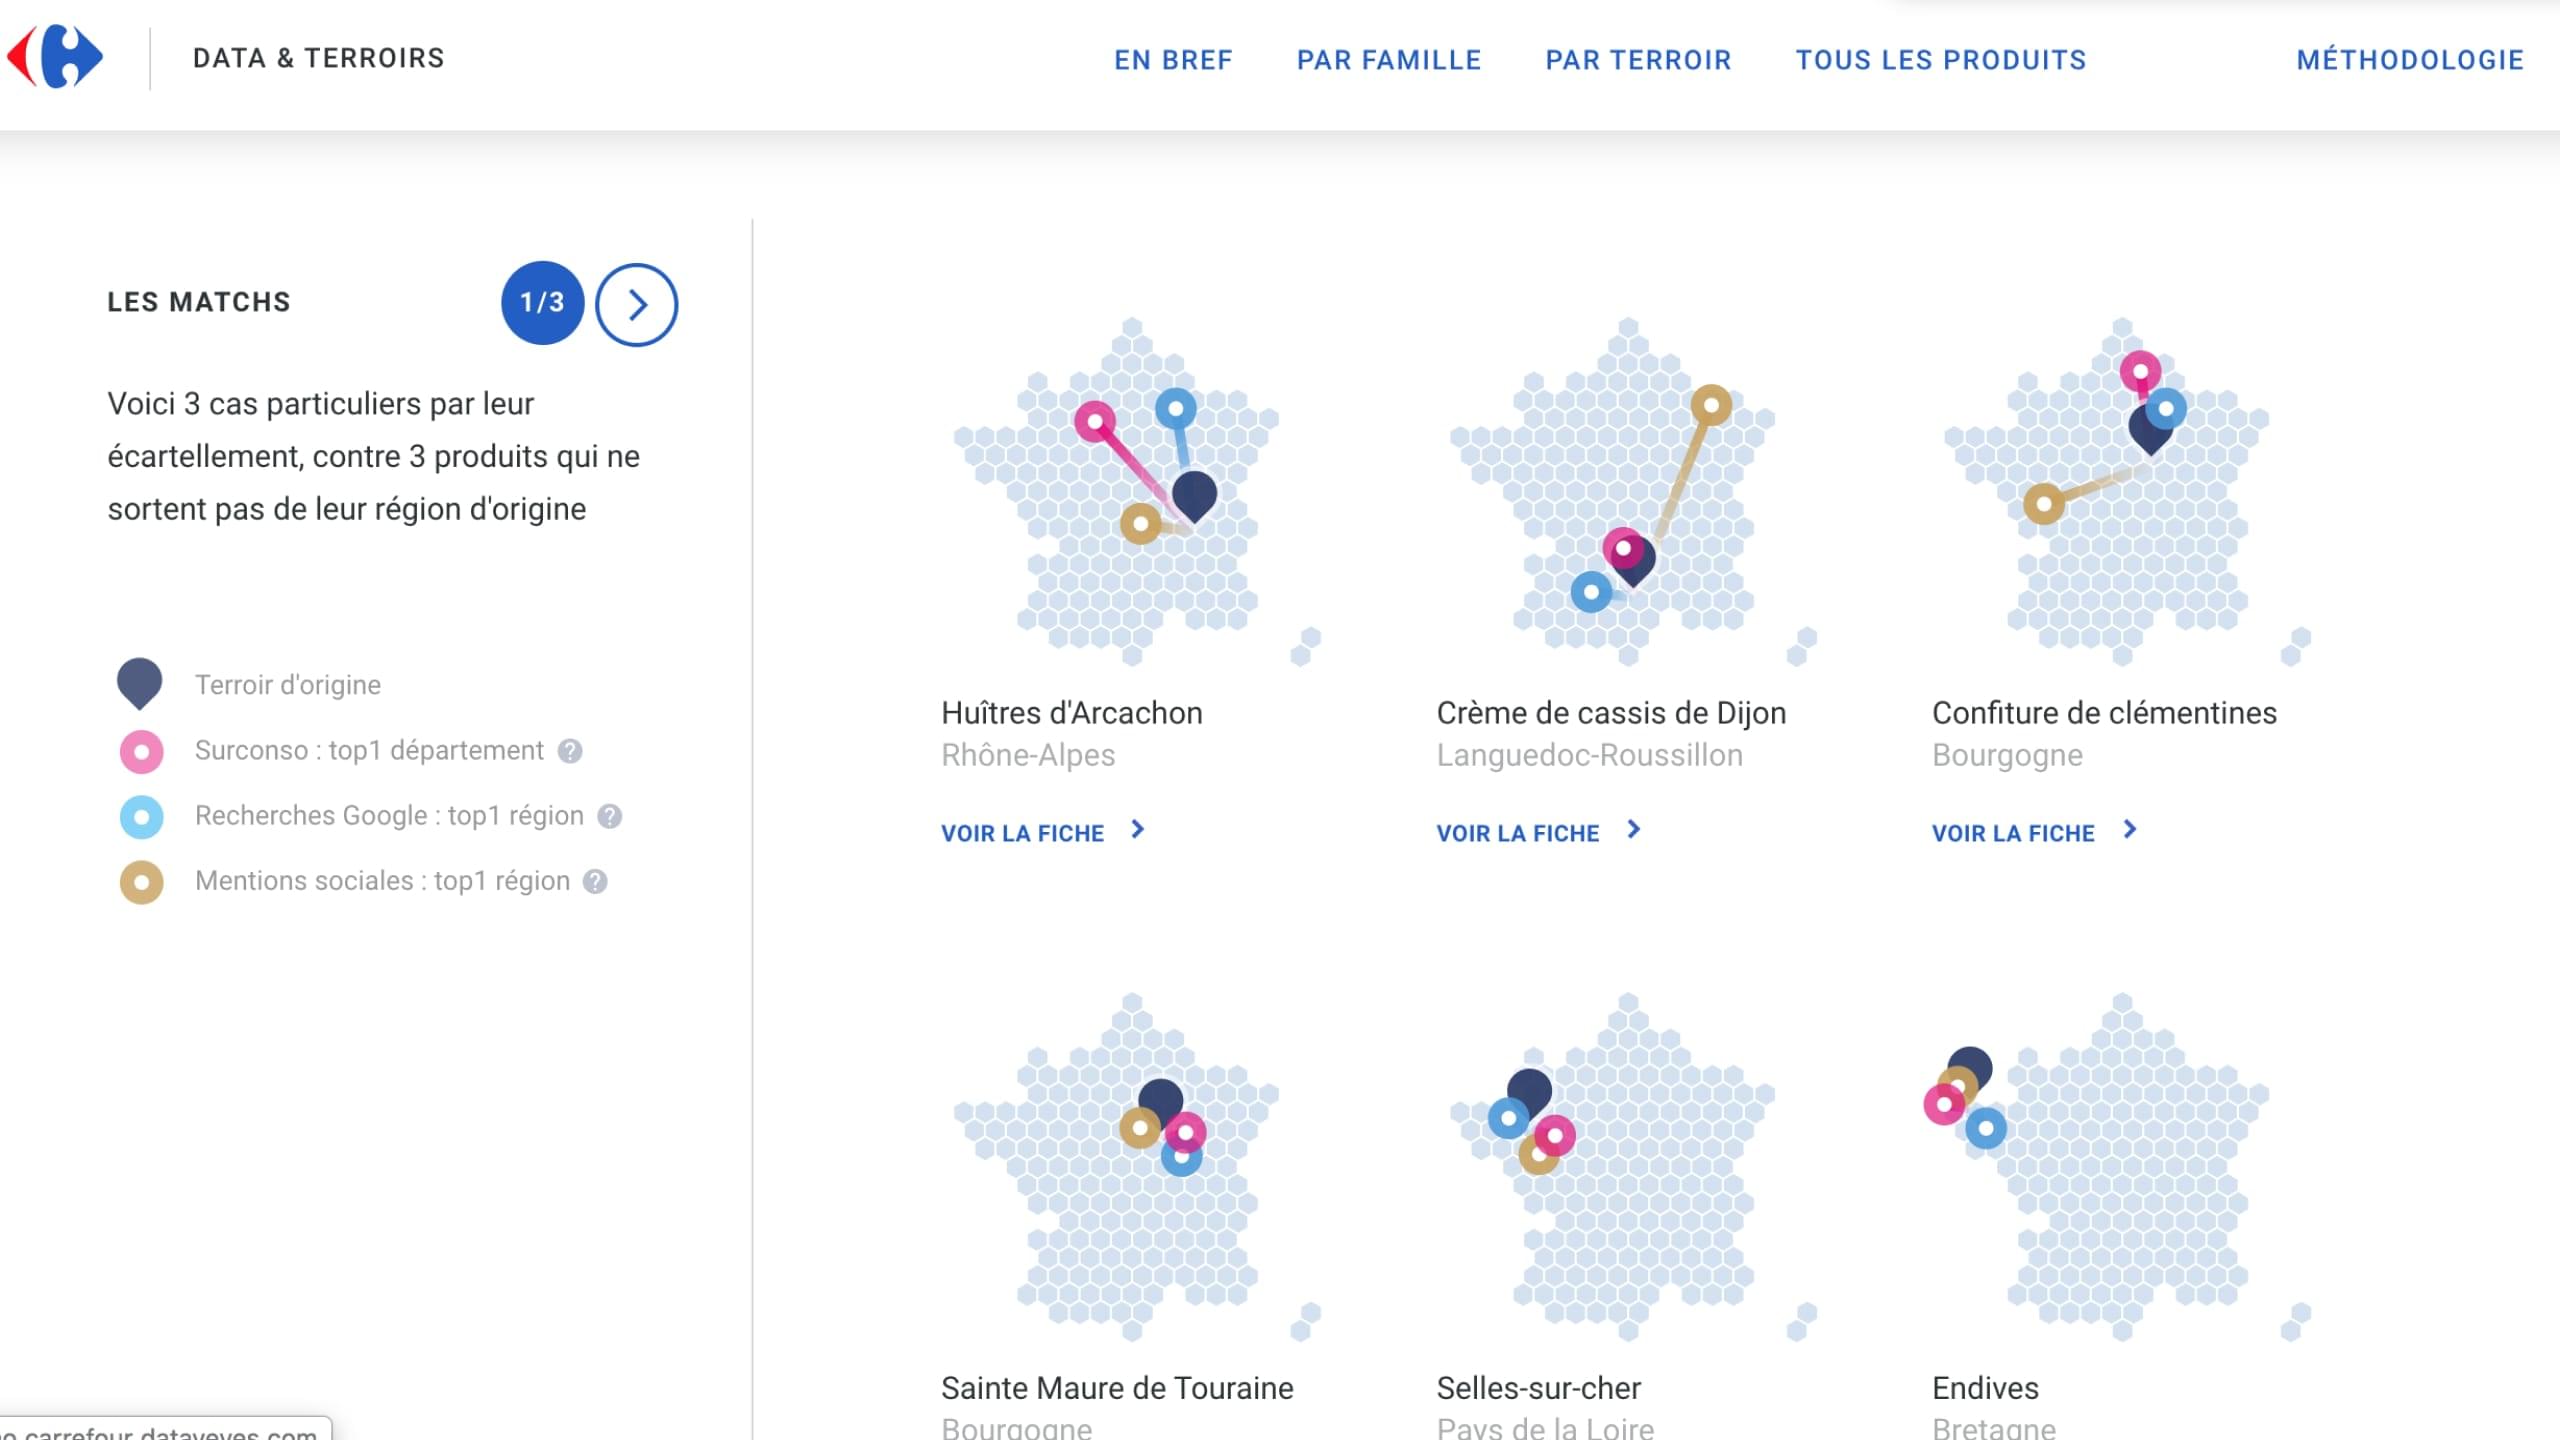
We used visualizations called ‘small multiples’ to tell stories with the data.
Method
In a first phase of research we identified the potential of this data to generate new knowledge and insights about the products. In a second phase, we designed visualization methods to present these insights. Finally, we developed, tested and deployed these visualization methods within a dynamic web application.
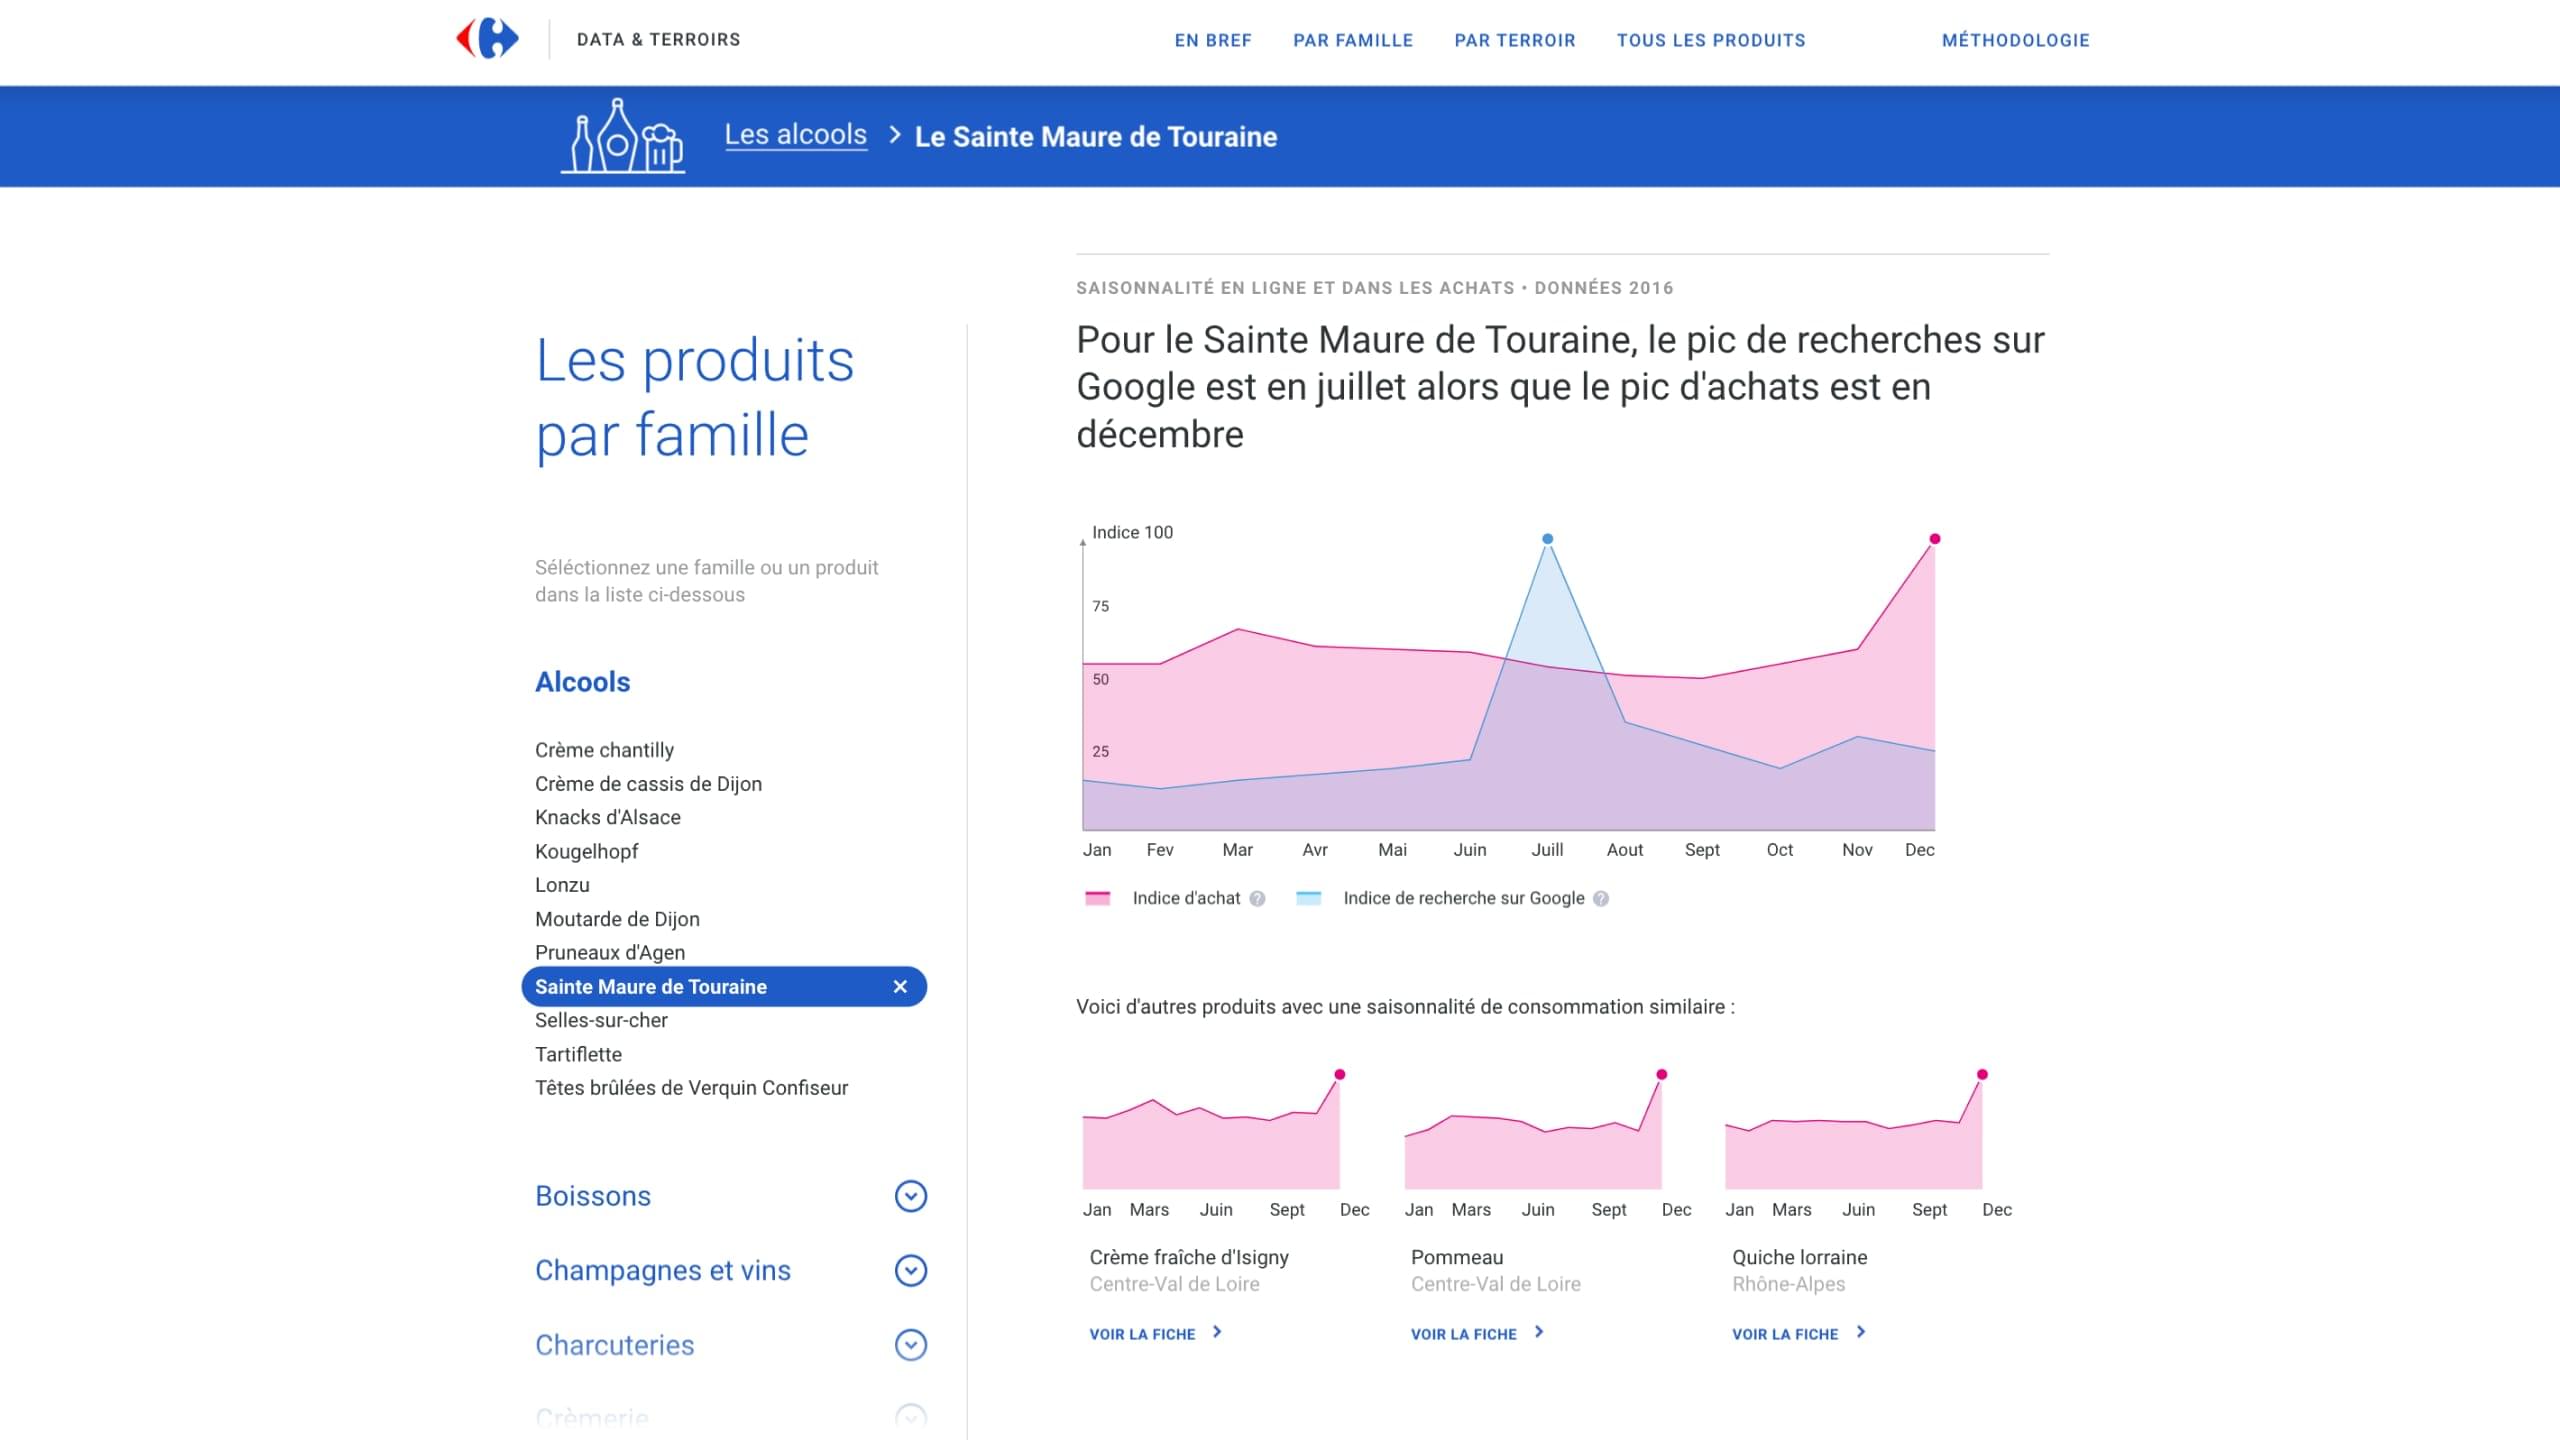
The curves highlight coincidences or discrepancies related to the time a product is searched on Google and the moment it is bought in-store.
Solution
The application offers two reading levels. The first presents the key insights learned from the data. The second gives users greater freedom to explore data through different avenues, such as by focusing on a product, geography or the way a product is consumed.
Highlight
The application offers two reading levels. The first presents the key insights learned from the data. The second gives users greater freedom to explore data through different avenues, such as by focusing on a product, geography or the way a product is consumed.
Subscribe to our newsletter:
75010 Paris
France