Application
Romi Plant Viewer
Enhancing the diagnostics of crop development by speeding up the verification of their measurements.
Client
ENS-Lyon/CNRS, Sony CSL, Inria
Date
2019 - 2 months
Results
The time to compare automatic and manual measurements has been divided by 4.
Launch project
We have provided the ROMI Plant Viewer project with a 3D visual analysis tool to help speed up the verification of plant measurements. It helps researchers diagnose crop development more efficiently and improve their image recognition algorithms.
Problem
The ROMI platform provides open-source tools to help organic and polyculture farming communities monitor their crops. Among these tools, image recognition algorithms can be used to extract measurements from the collected plant scans. The results of these algorithms are not directly readable, and require an interface to be understood, verified and processed. Sony Computer Science Lab entrusted us with the creation of this interface.
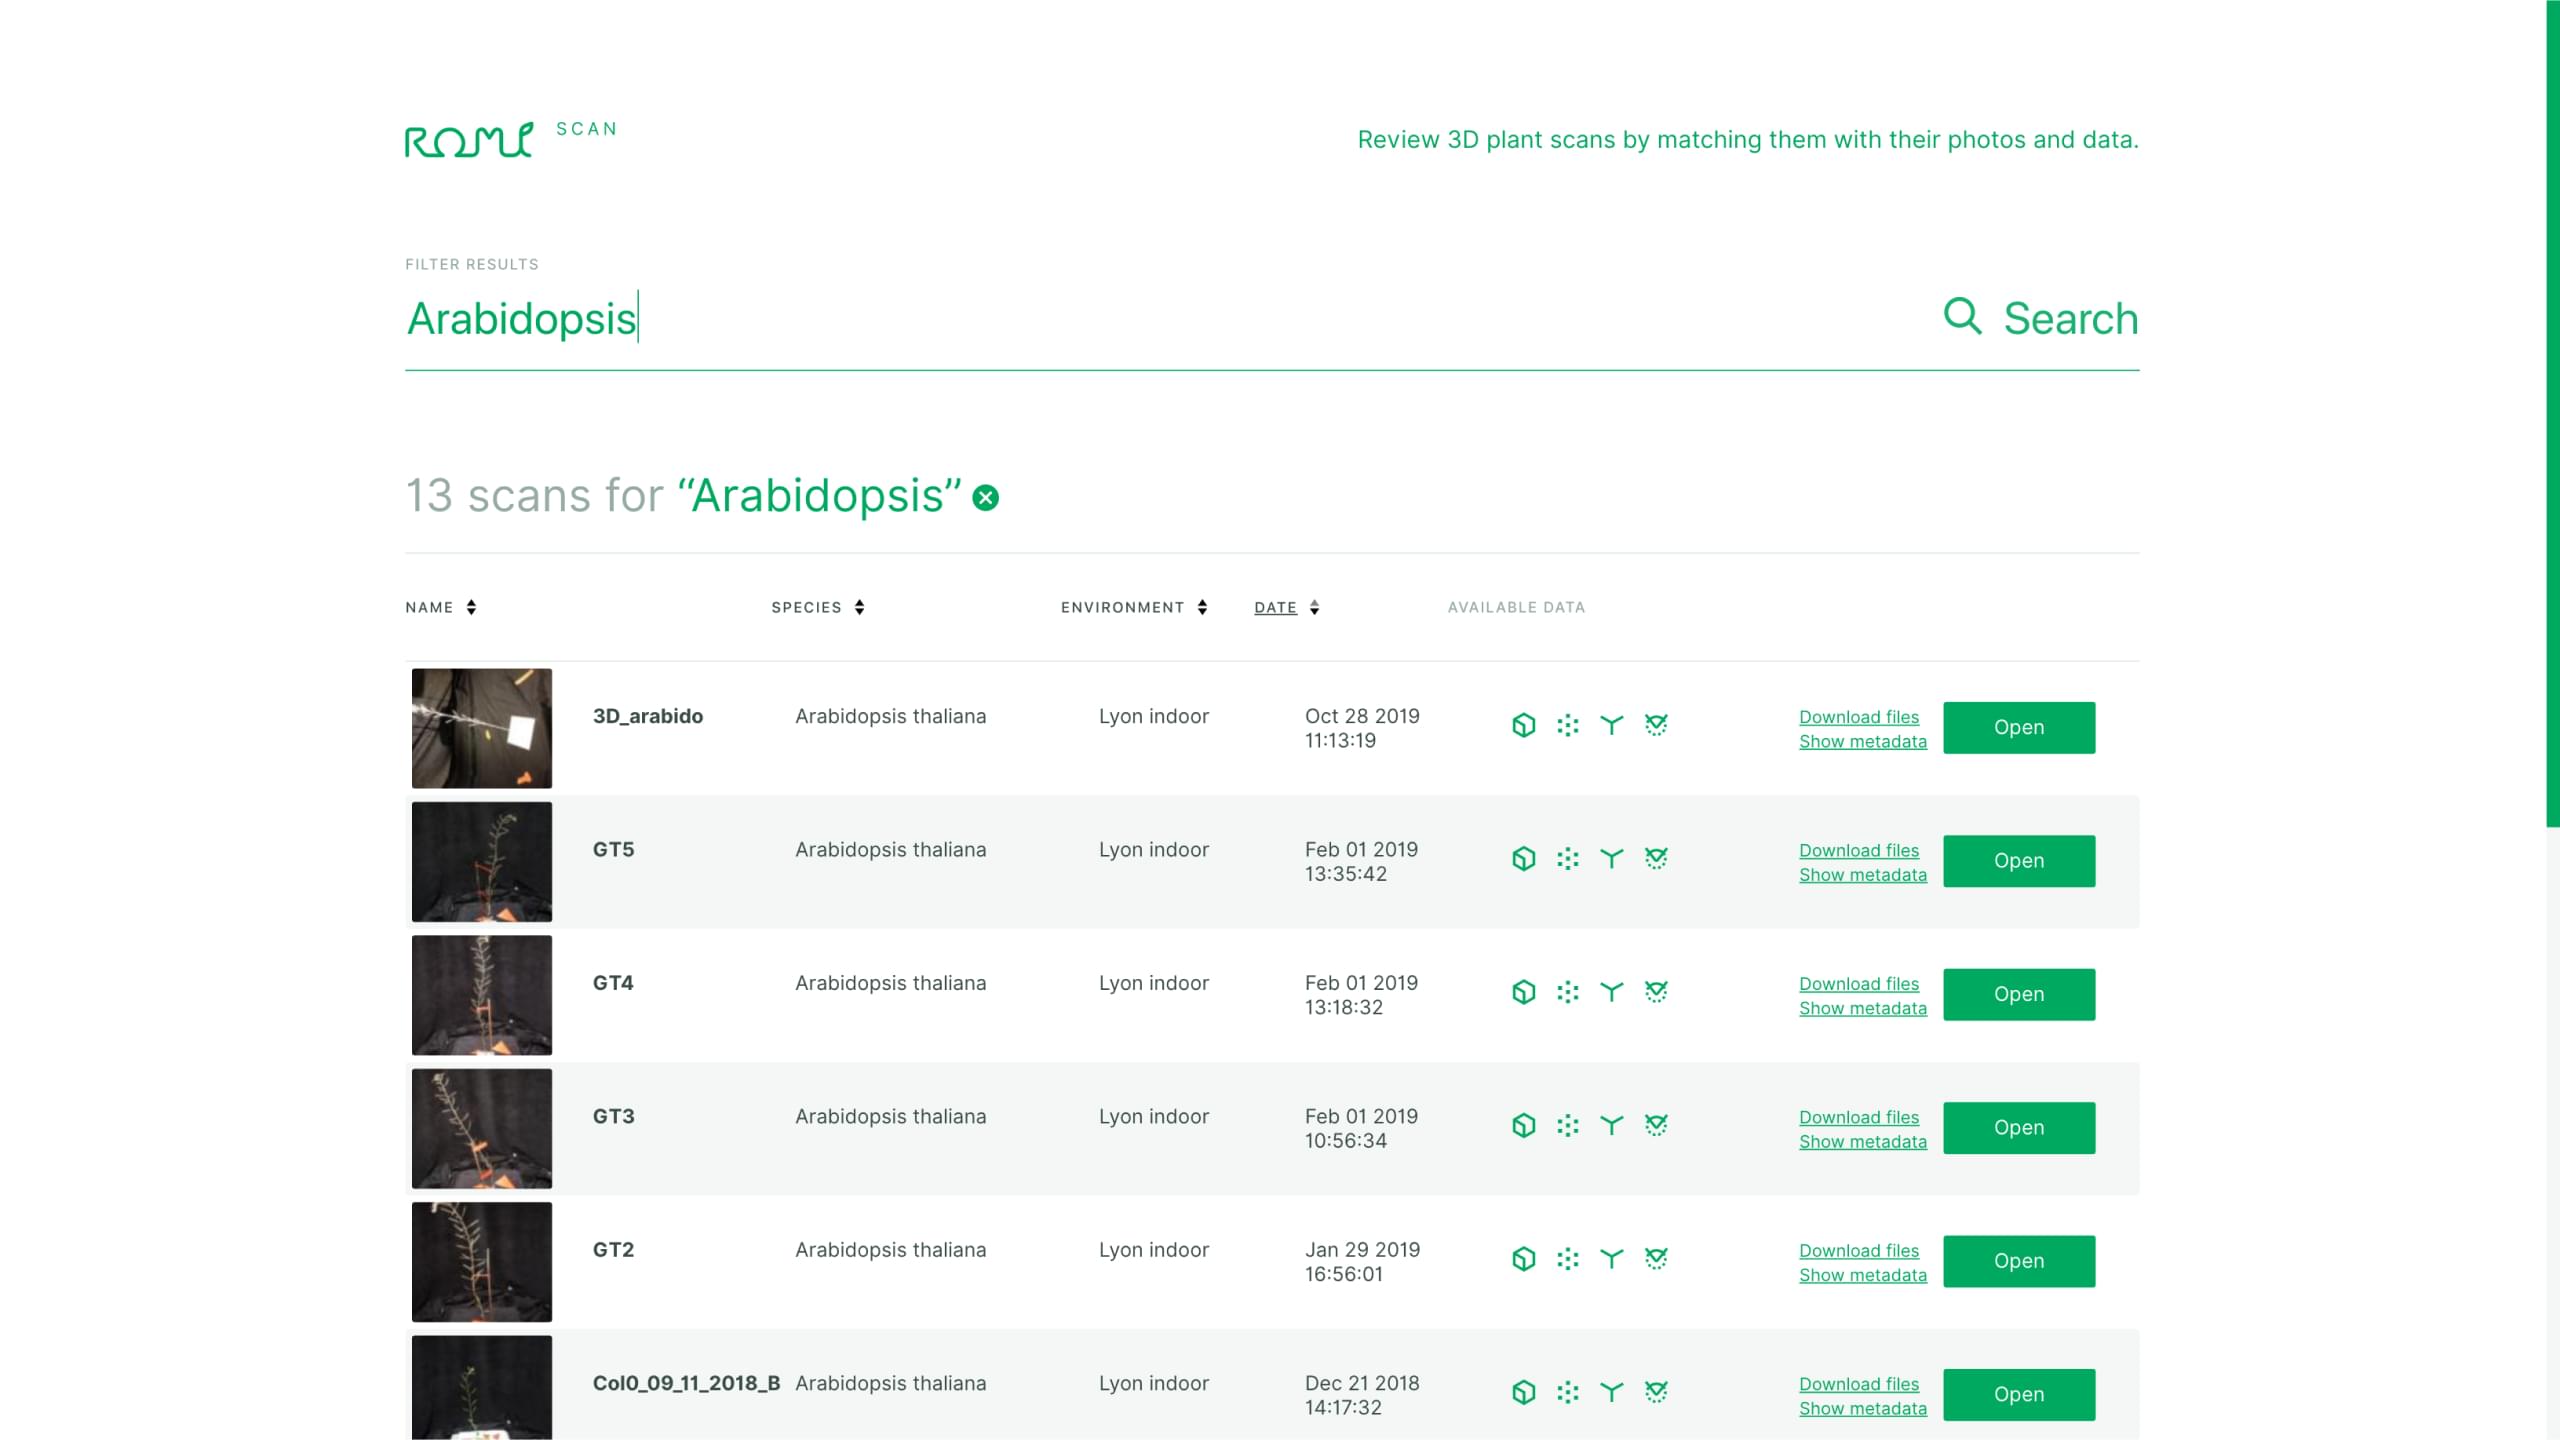
The Romi Scan tool allows researchers from different laboratories to collaborate on automatic plant measurement algorithms.
Data
Currently, the data used comes from laboratory experiments, in which plants are measured using a photogrammetry box. In the future, these measurements will be taken by robots and light drones directly in the fields.
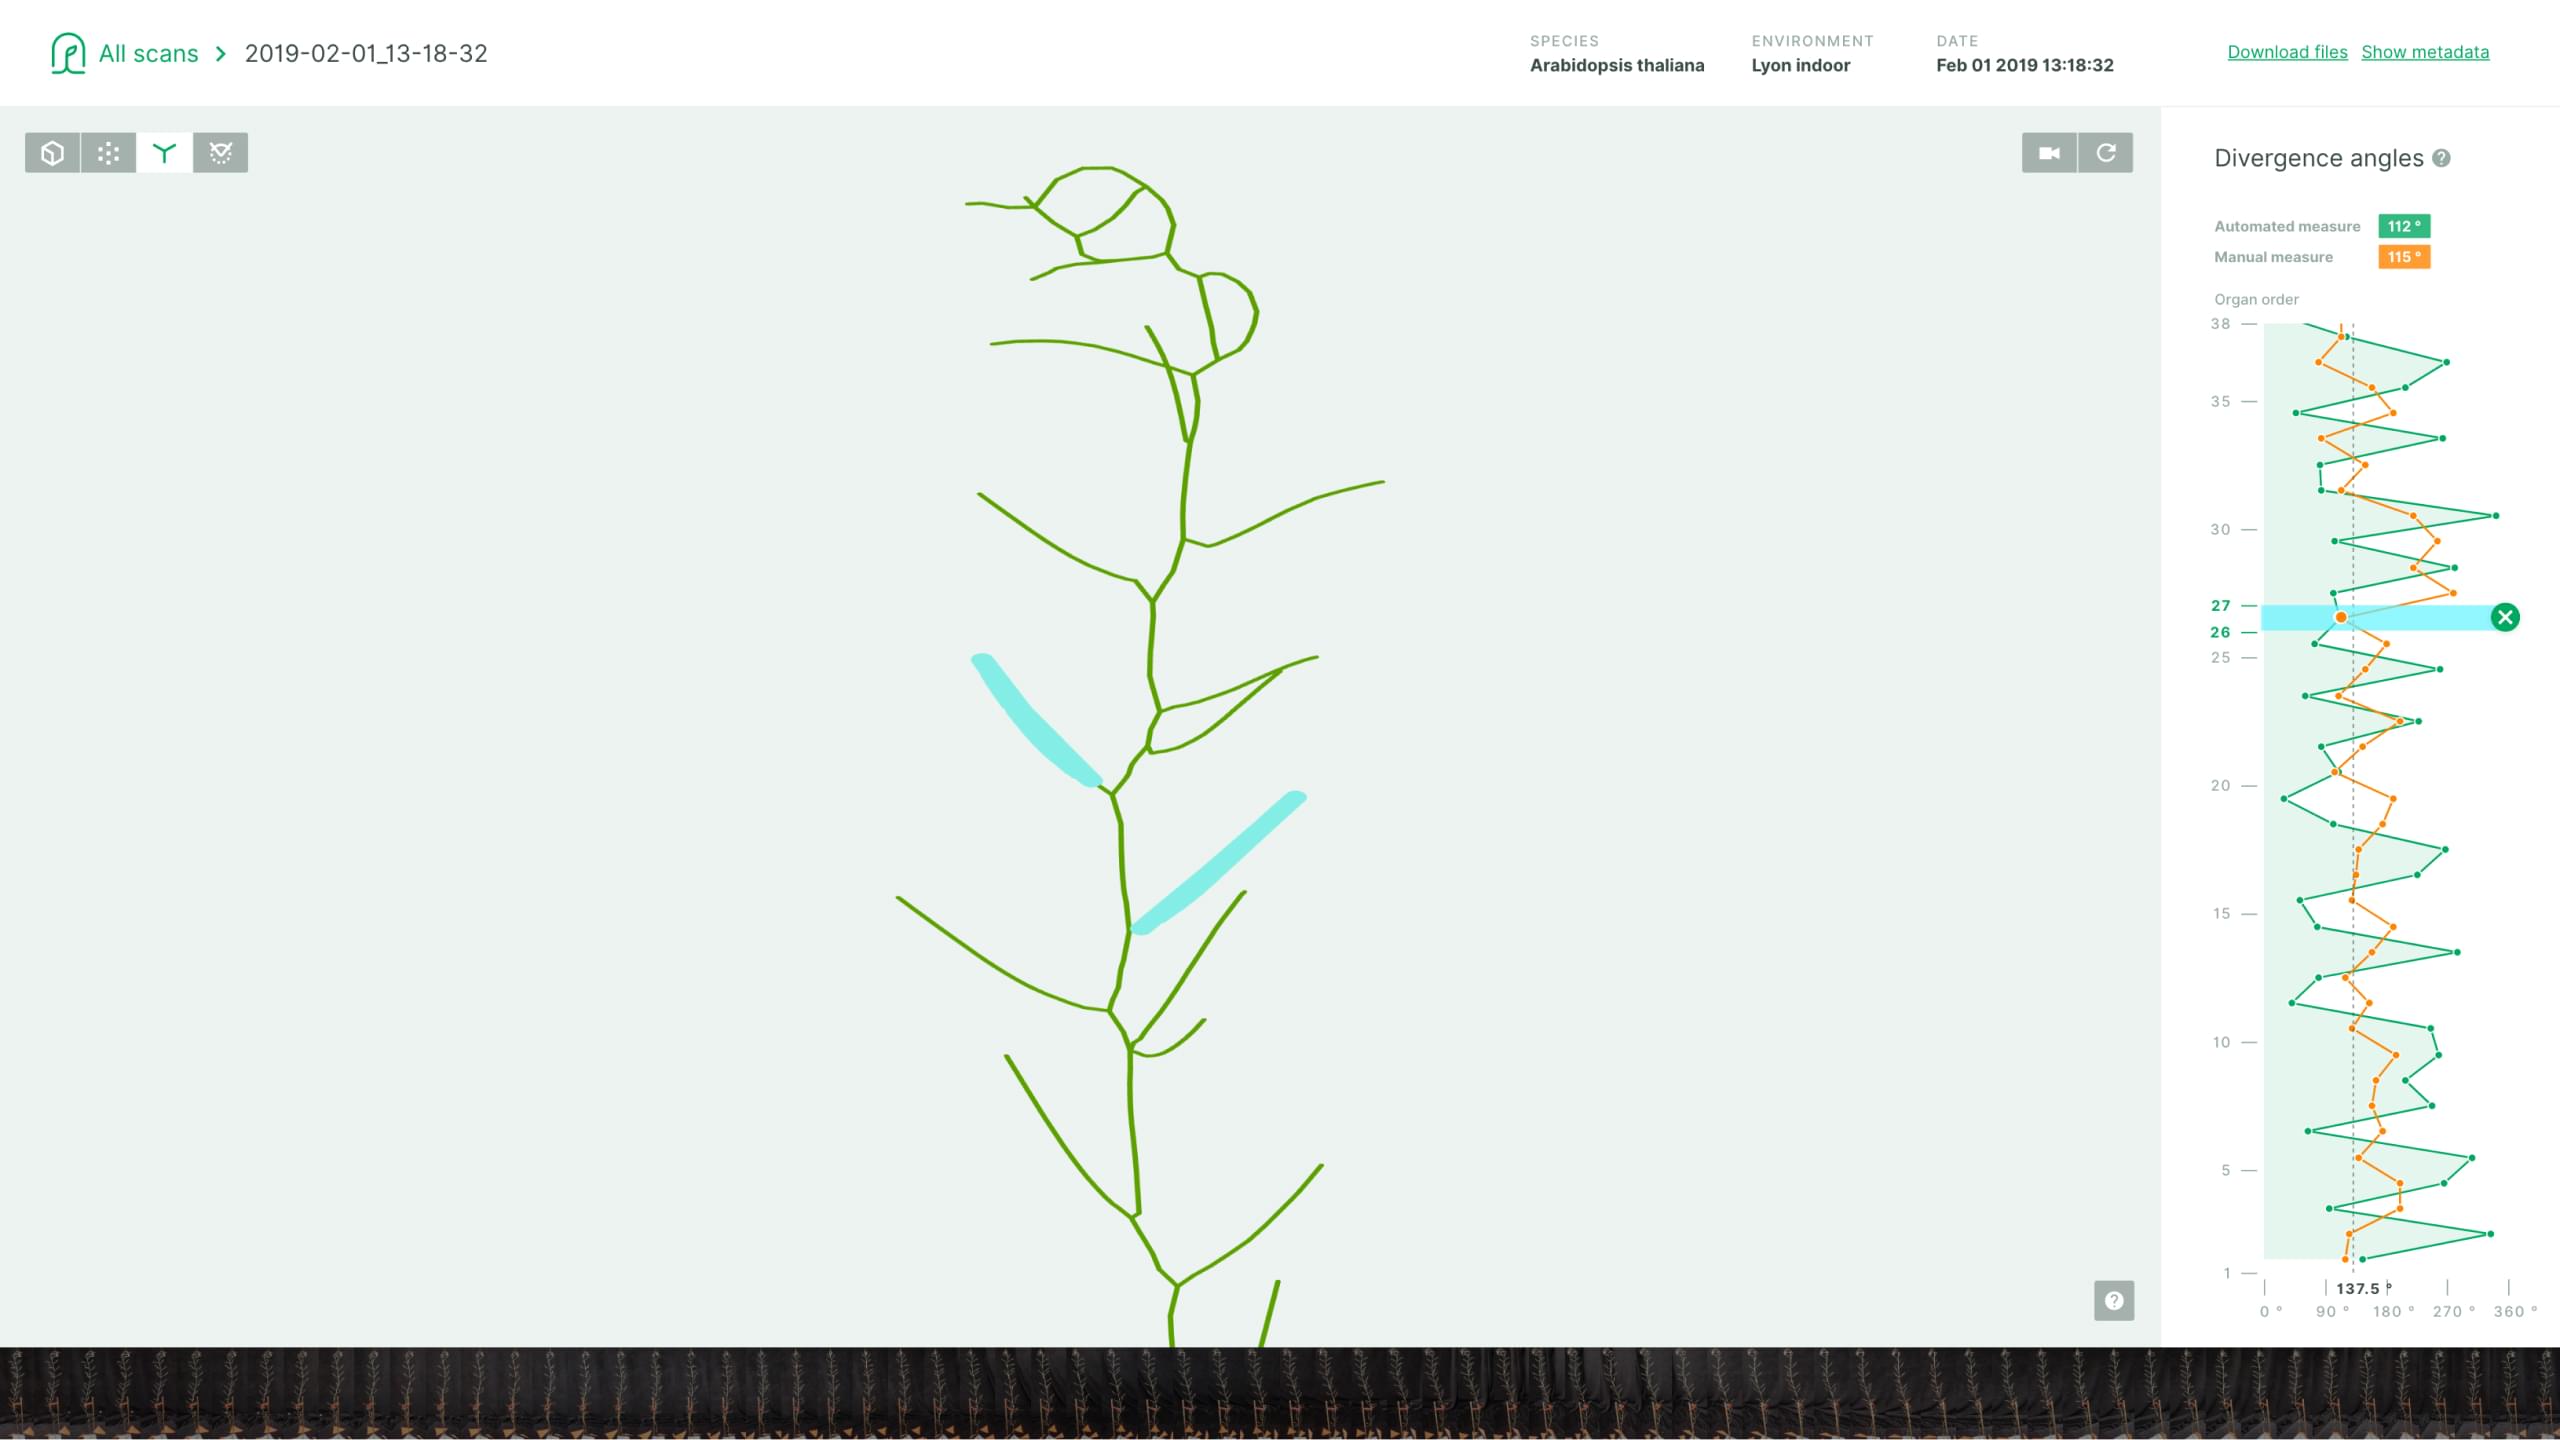
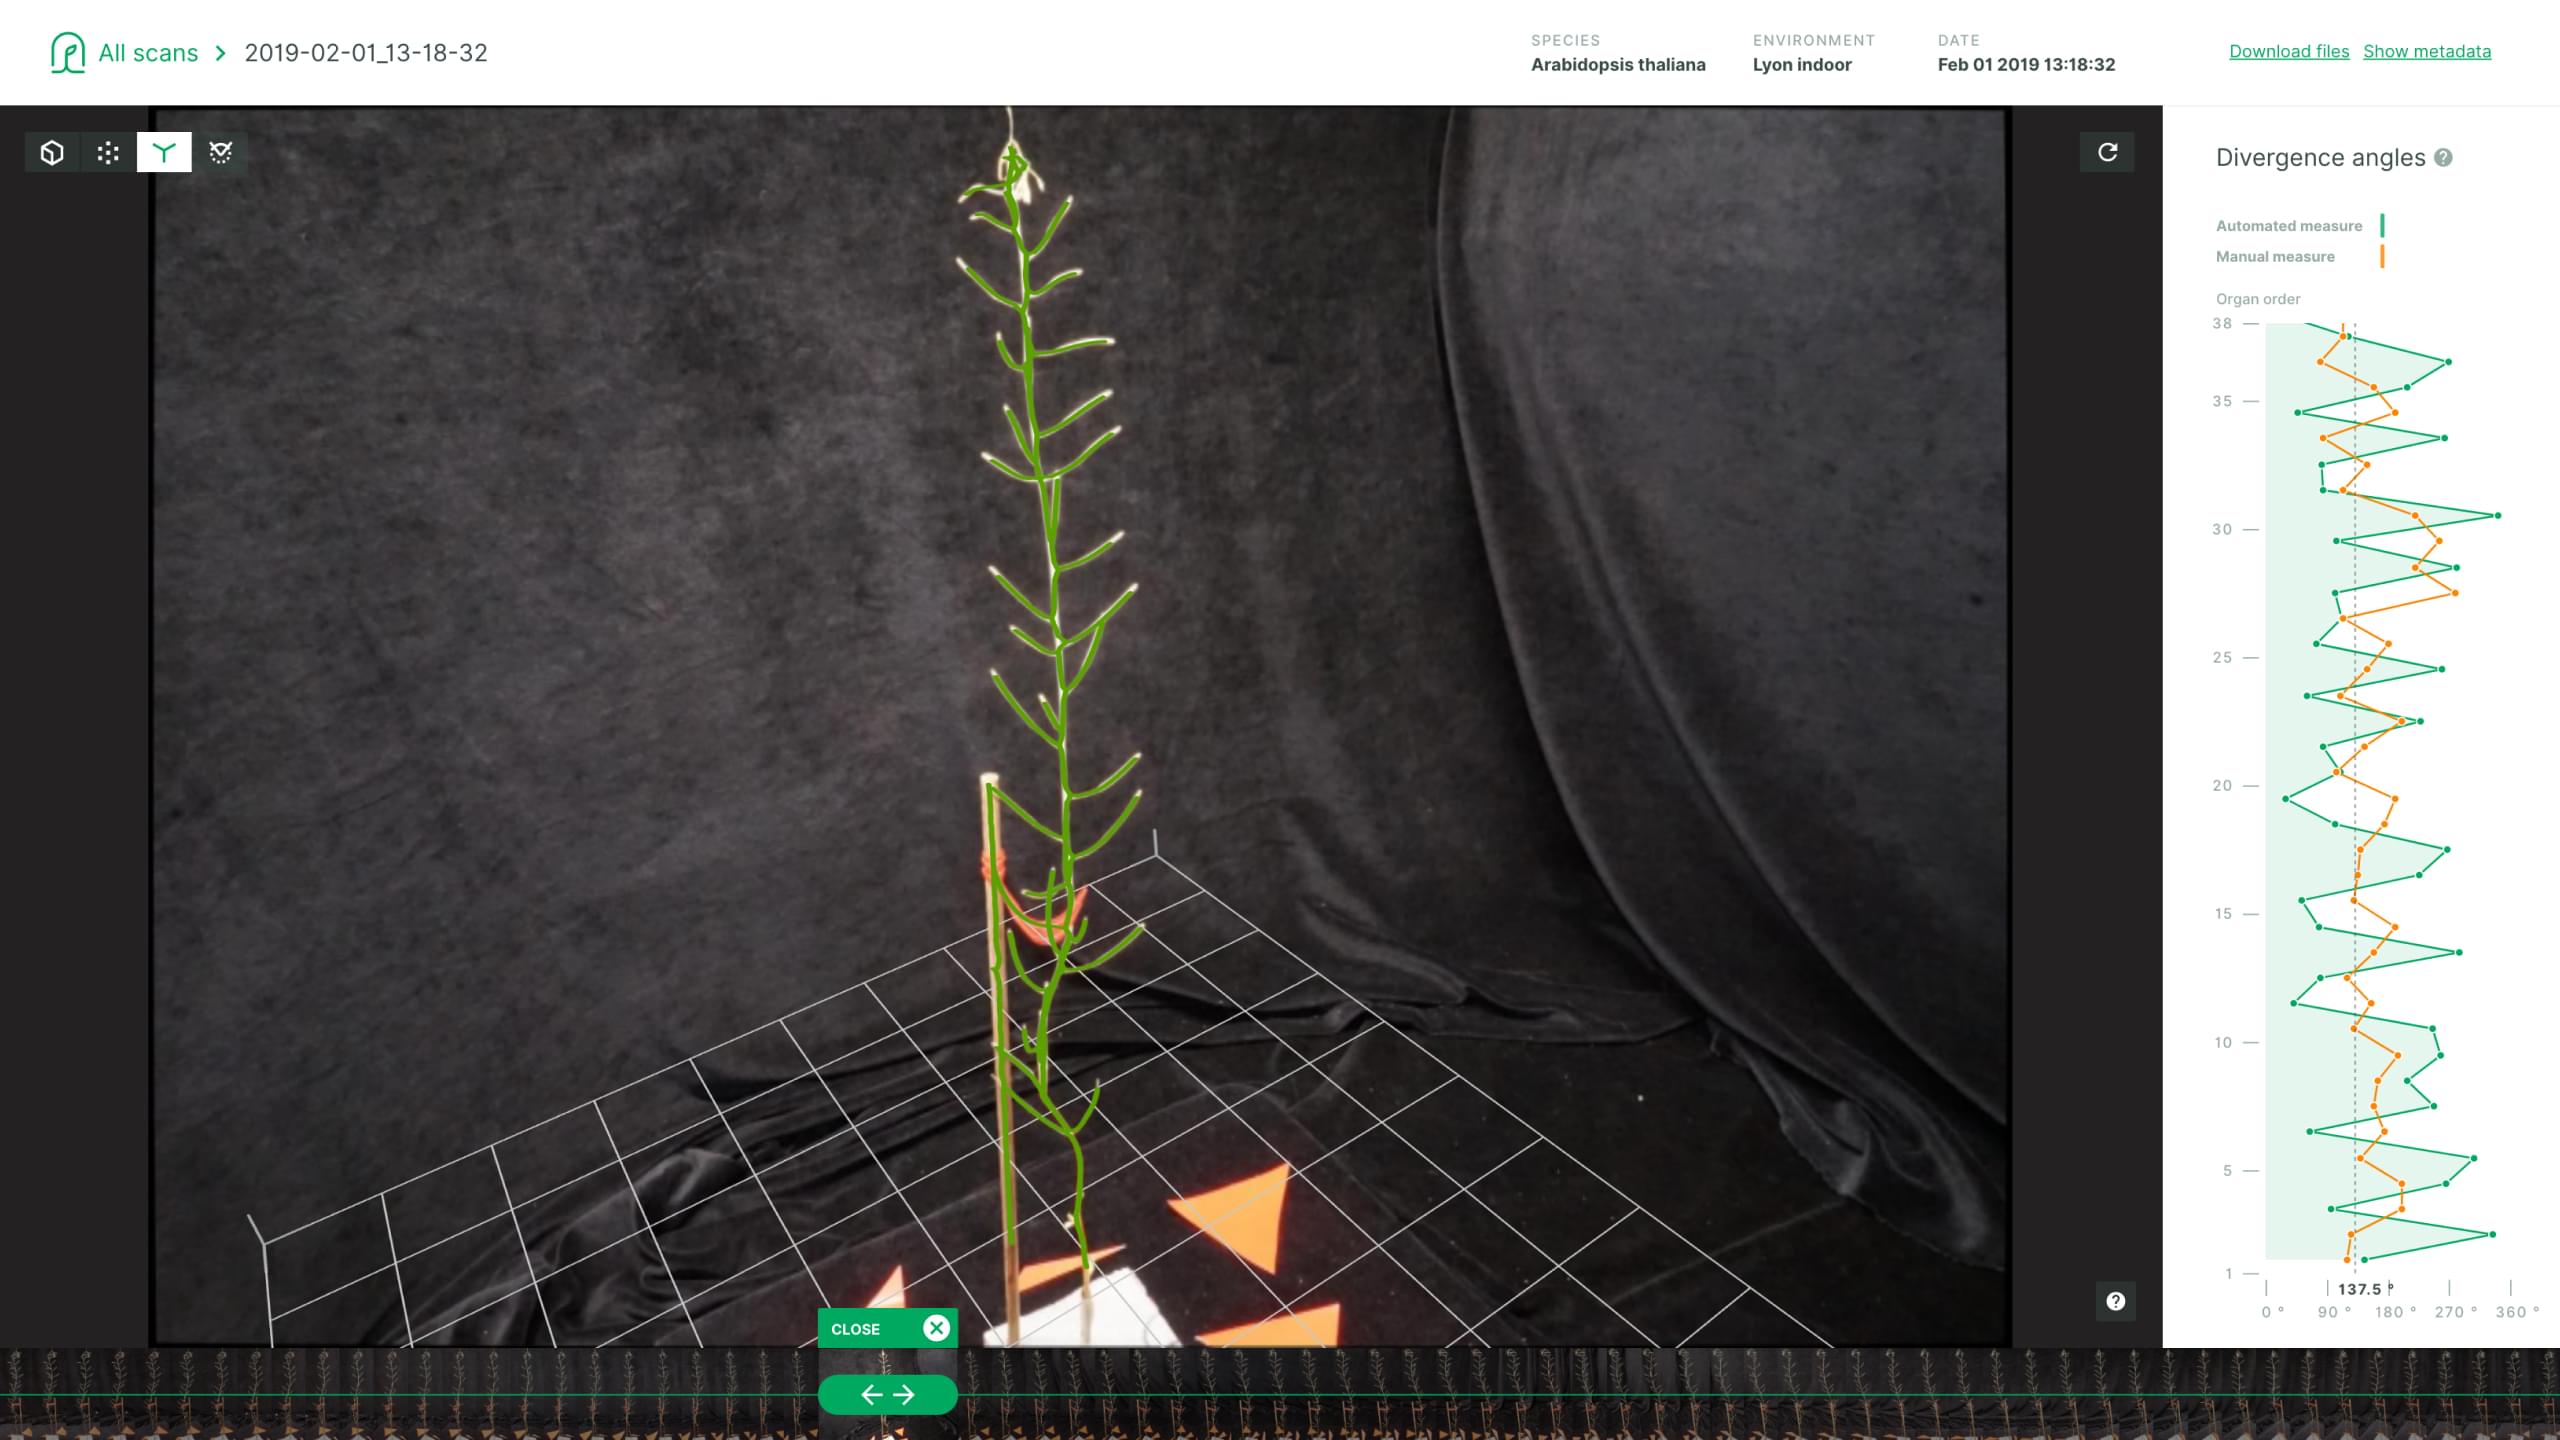
Using the visual analytics tool, researchers can check internode distances and divergence angles to analyze plant development.
Method
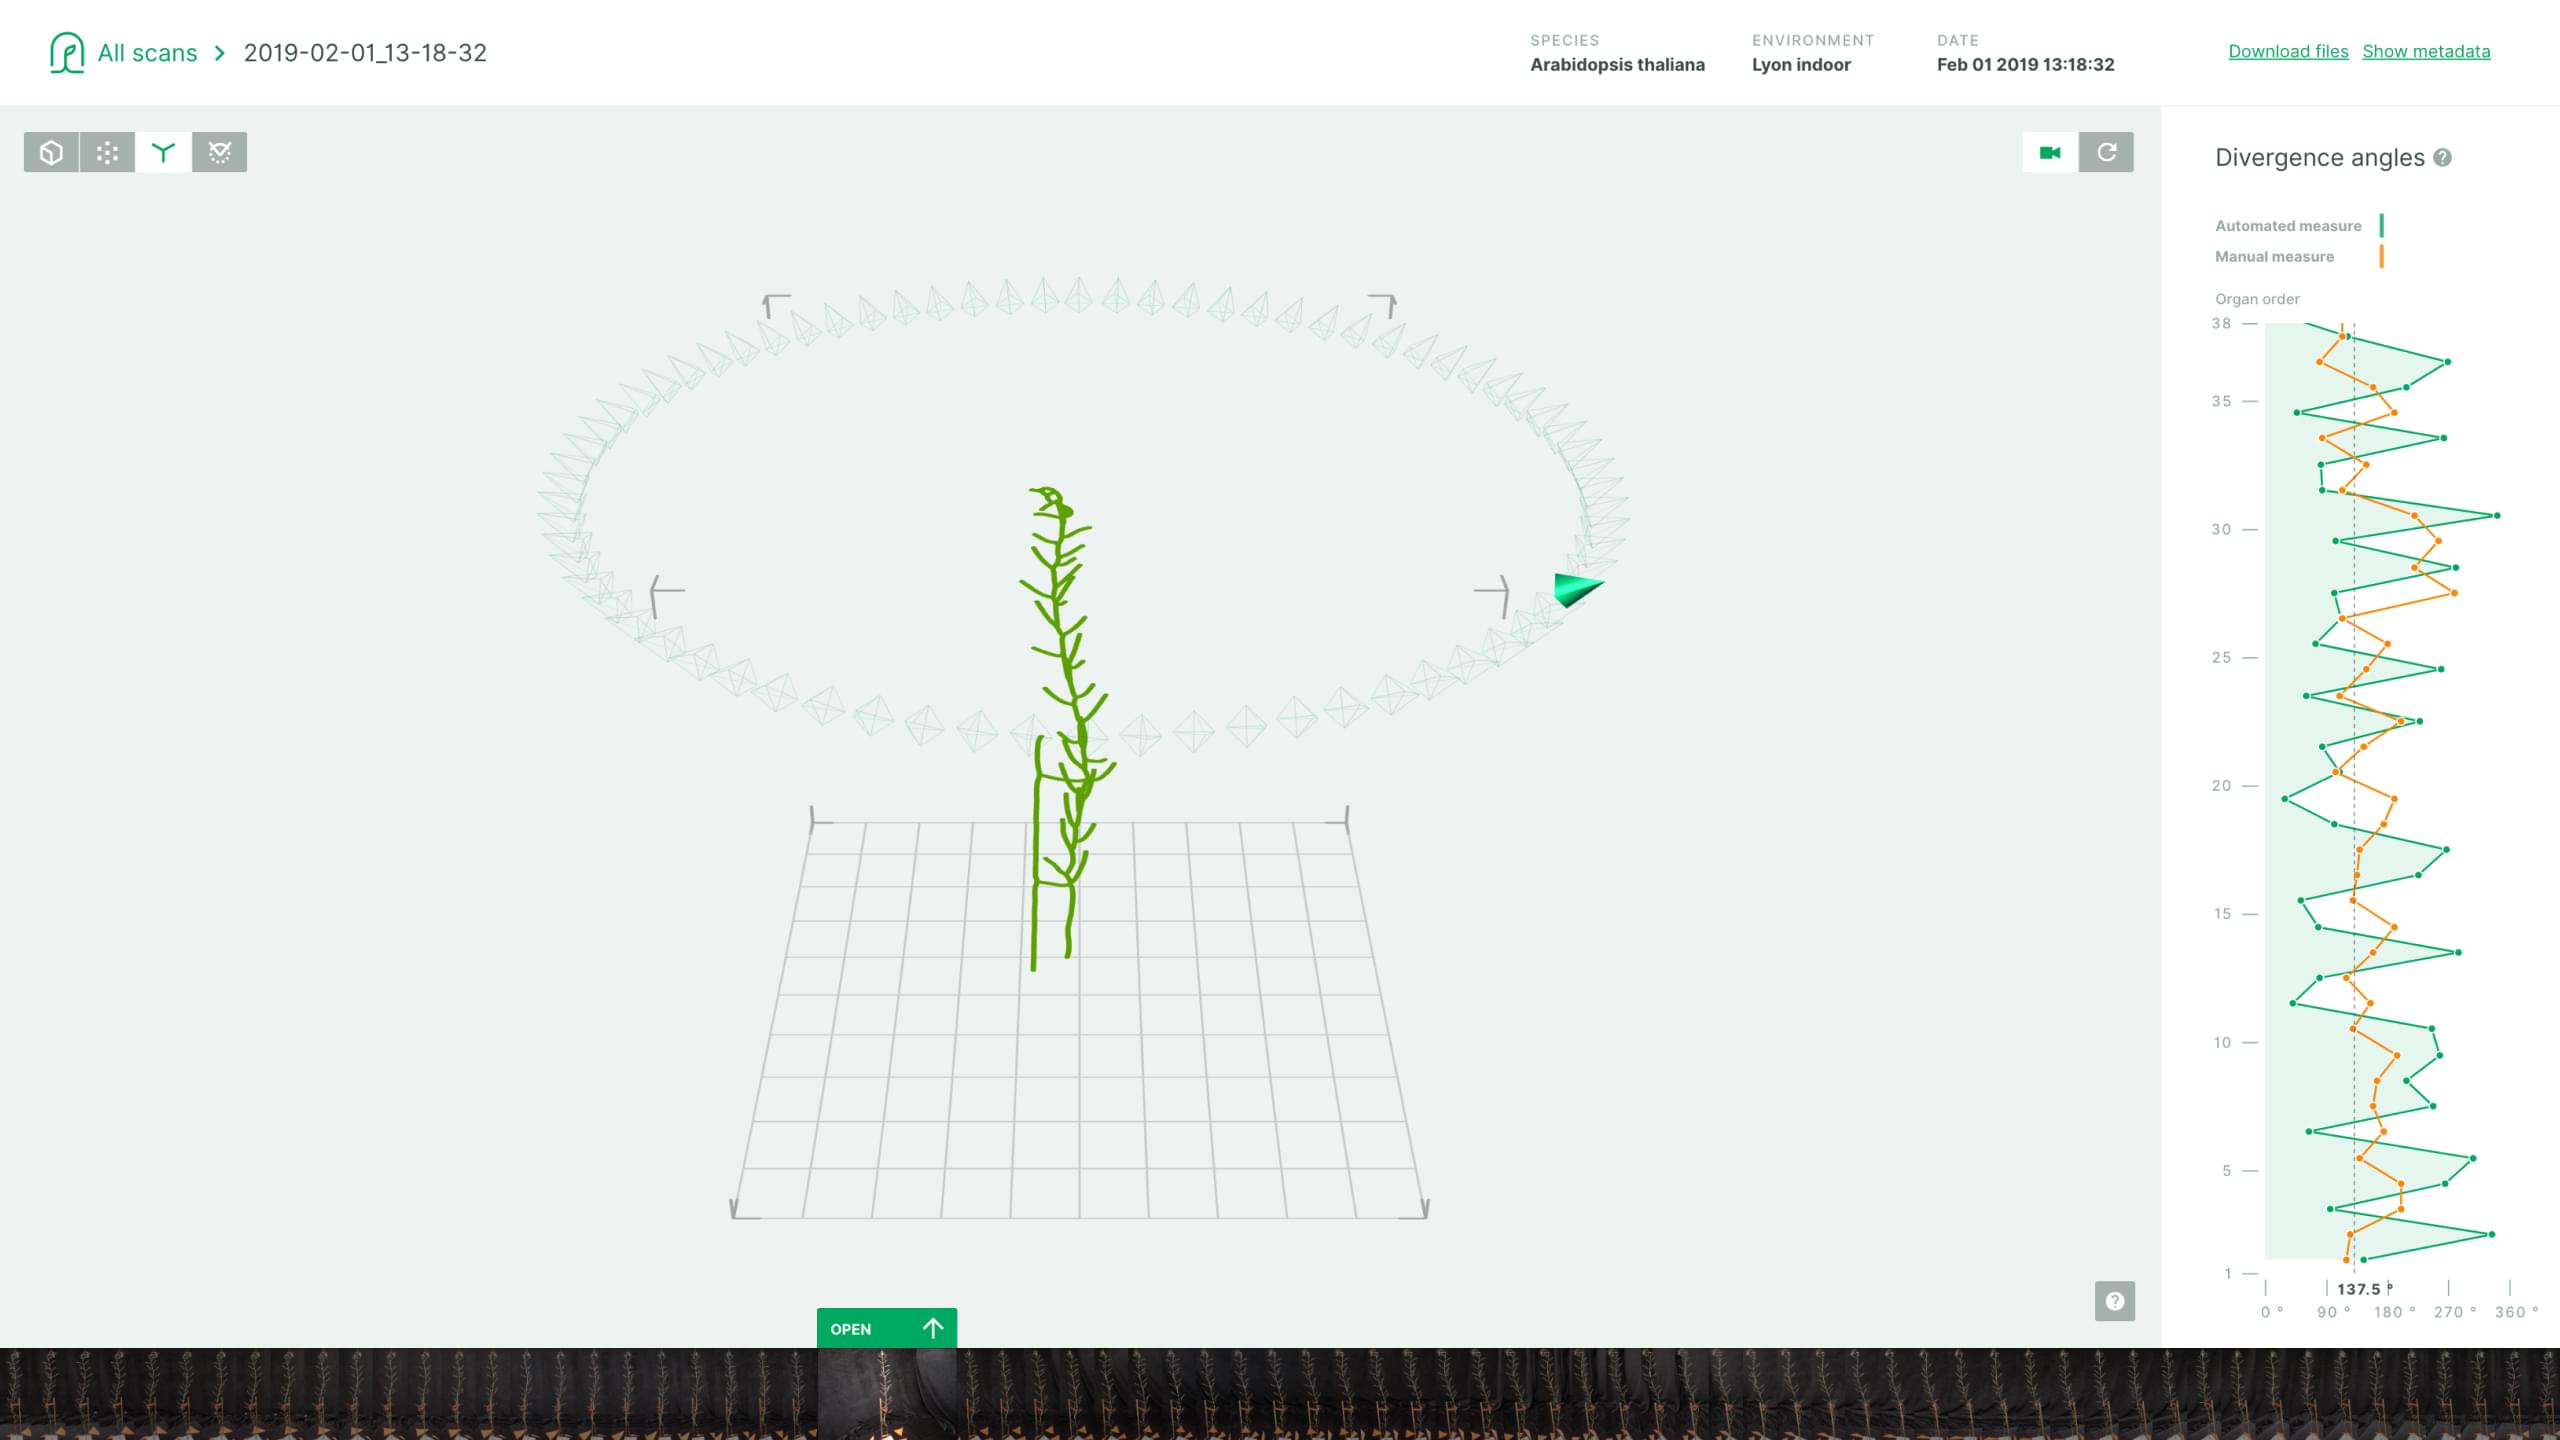
The ability to render data in 3D and match it to the plant scans was crucial for this project. We therefore carried out 3D rendering tests right from the start, to quickly assess technical feasibility. We then focused on developing the interface’s usability and user experience by making wireframes.
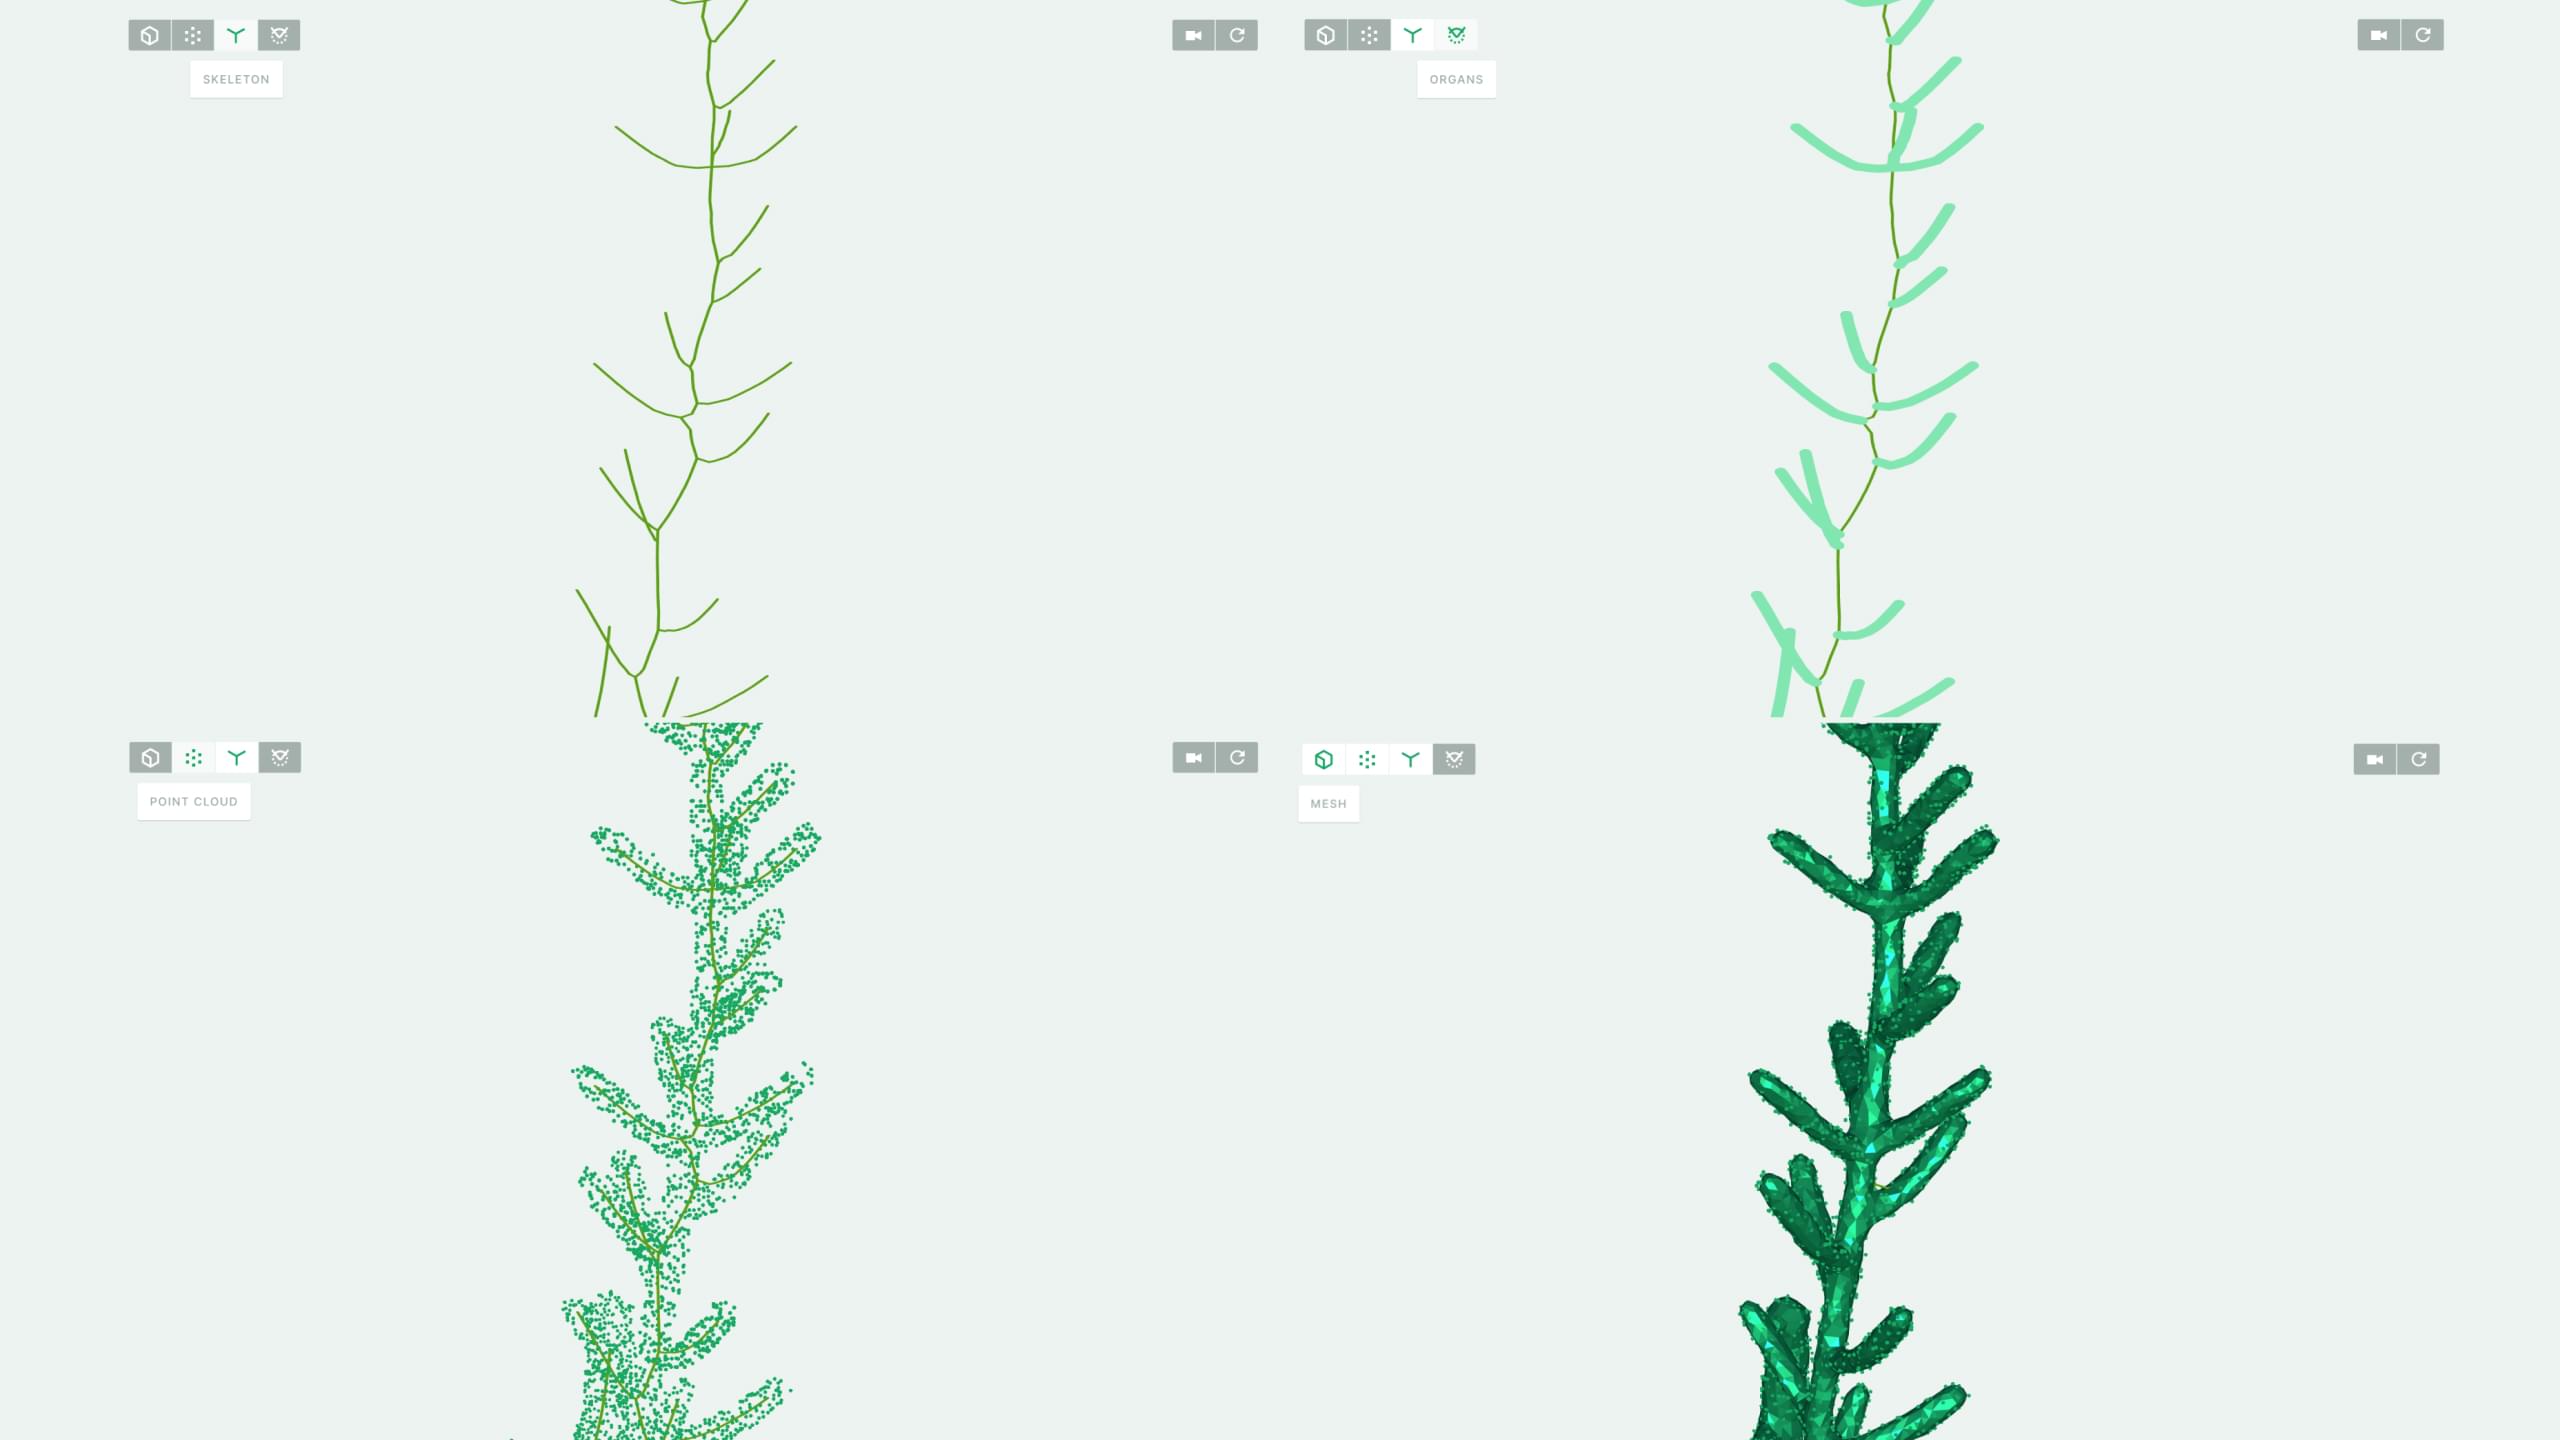
Experts can verify the quality of the photogrammetric scans using several view modes: a Mesh view, a Point Cloud view, a Skeleton view, and an Organs view.
Solution
We used 3D modeling and interactive data visualization to help researchers quickly check the quality of photogrammetric scans. We designed the interface to make it easy to compare automatically collected data with manual measurements. This allows researchers to swiftly identify problems within their algorithms and improve them.
Highlight
The interface allows researchers to save significant time when analyzing the results of their algorithms. Furthermore, it improves their working comfort and allows them to focus on essential information. Finally, the tool promotes collaboration between researchers by centralizing measurements and experiments carried out in different laboratories.
ROMI is part of the European Union’s research and innovation program “Horizon 2020” (grant agreement ID: 773875). The project’s source code has been made public on https://github.com/romi/3d-plantviewer.
Subscribe to our newsletter:
75010 Paris
France