Tool
Skills mapping
Foster better HR strategies by visualizing the organization, its skill sets and career pathways.
Client
Confidential
Date
2016 - 6 months
Results
The prototype was used to develop our client's recruitment policy in 2017.
We designed a decision support tool based on the use of data from job descriptions and internal mobility. We revealed the rich potential of this data to guide human resources strategy in terms of managing jobs and careers.
Problem
Our client had a large set of historical files cataloguing job descriptions and internal mobility between positions for all areas of their business. These files had never been used as a database, nor analyzed retrospectively. Our client asked us to create a tool to enable this data to be used as part of an improved job and career management strategy.
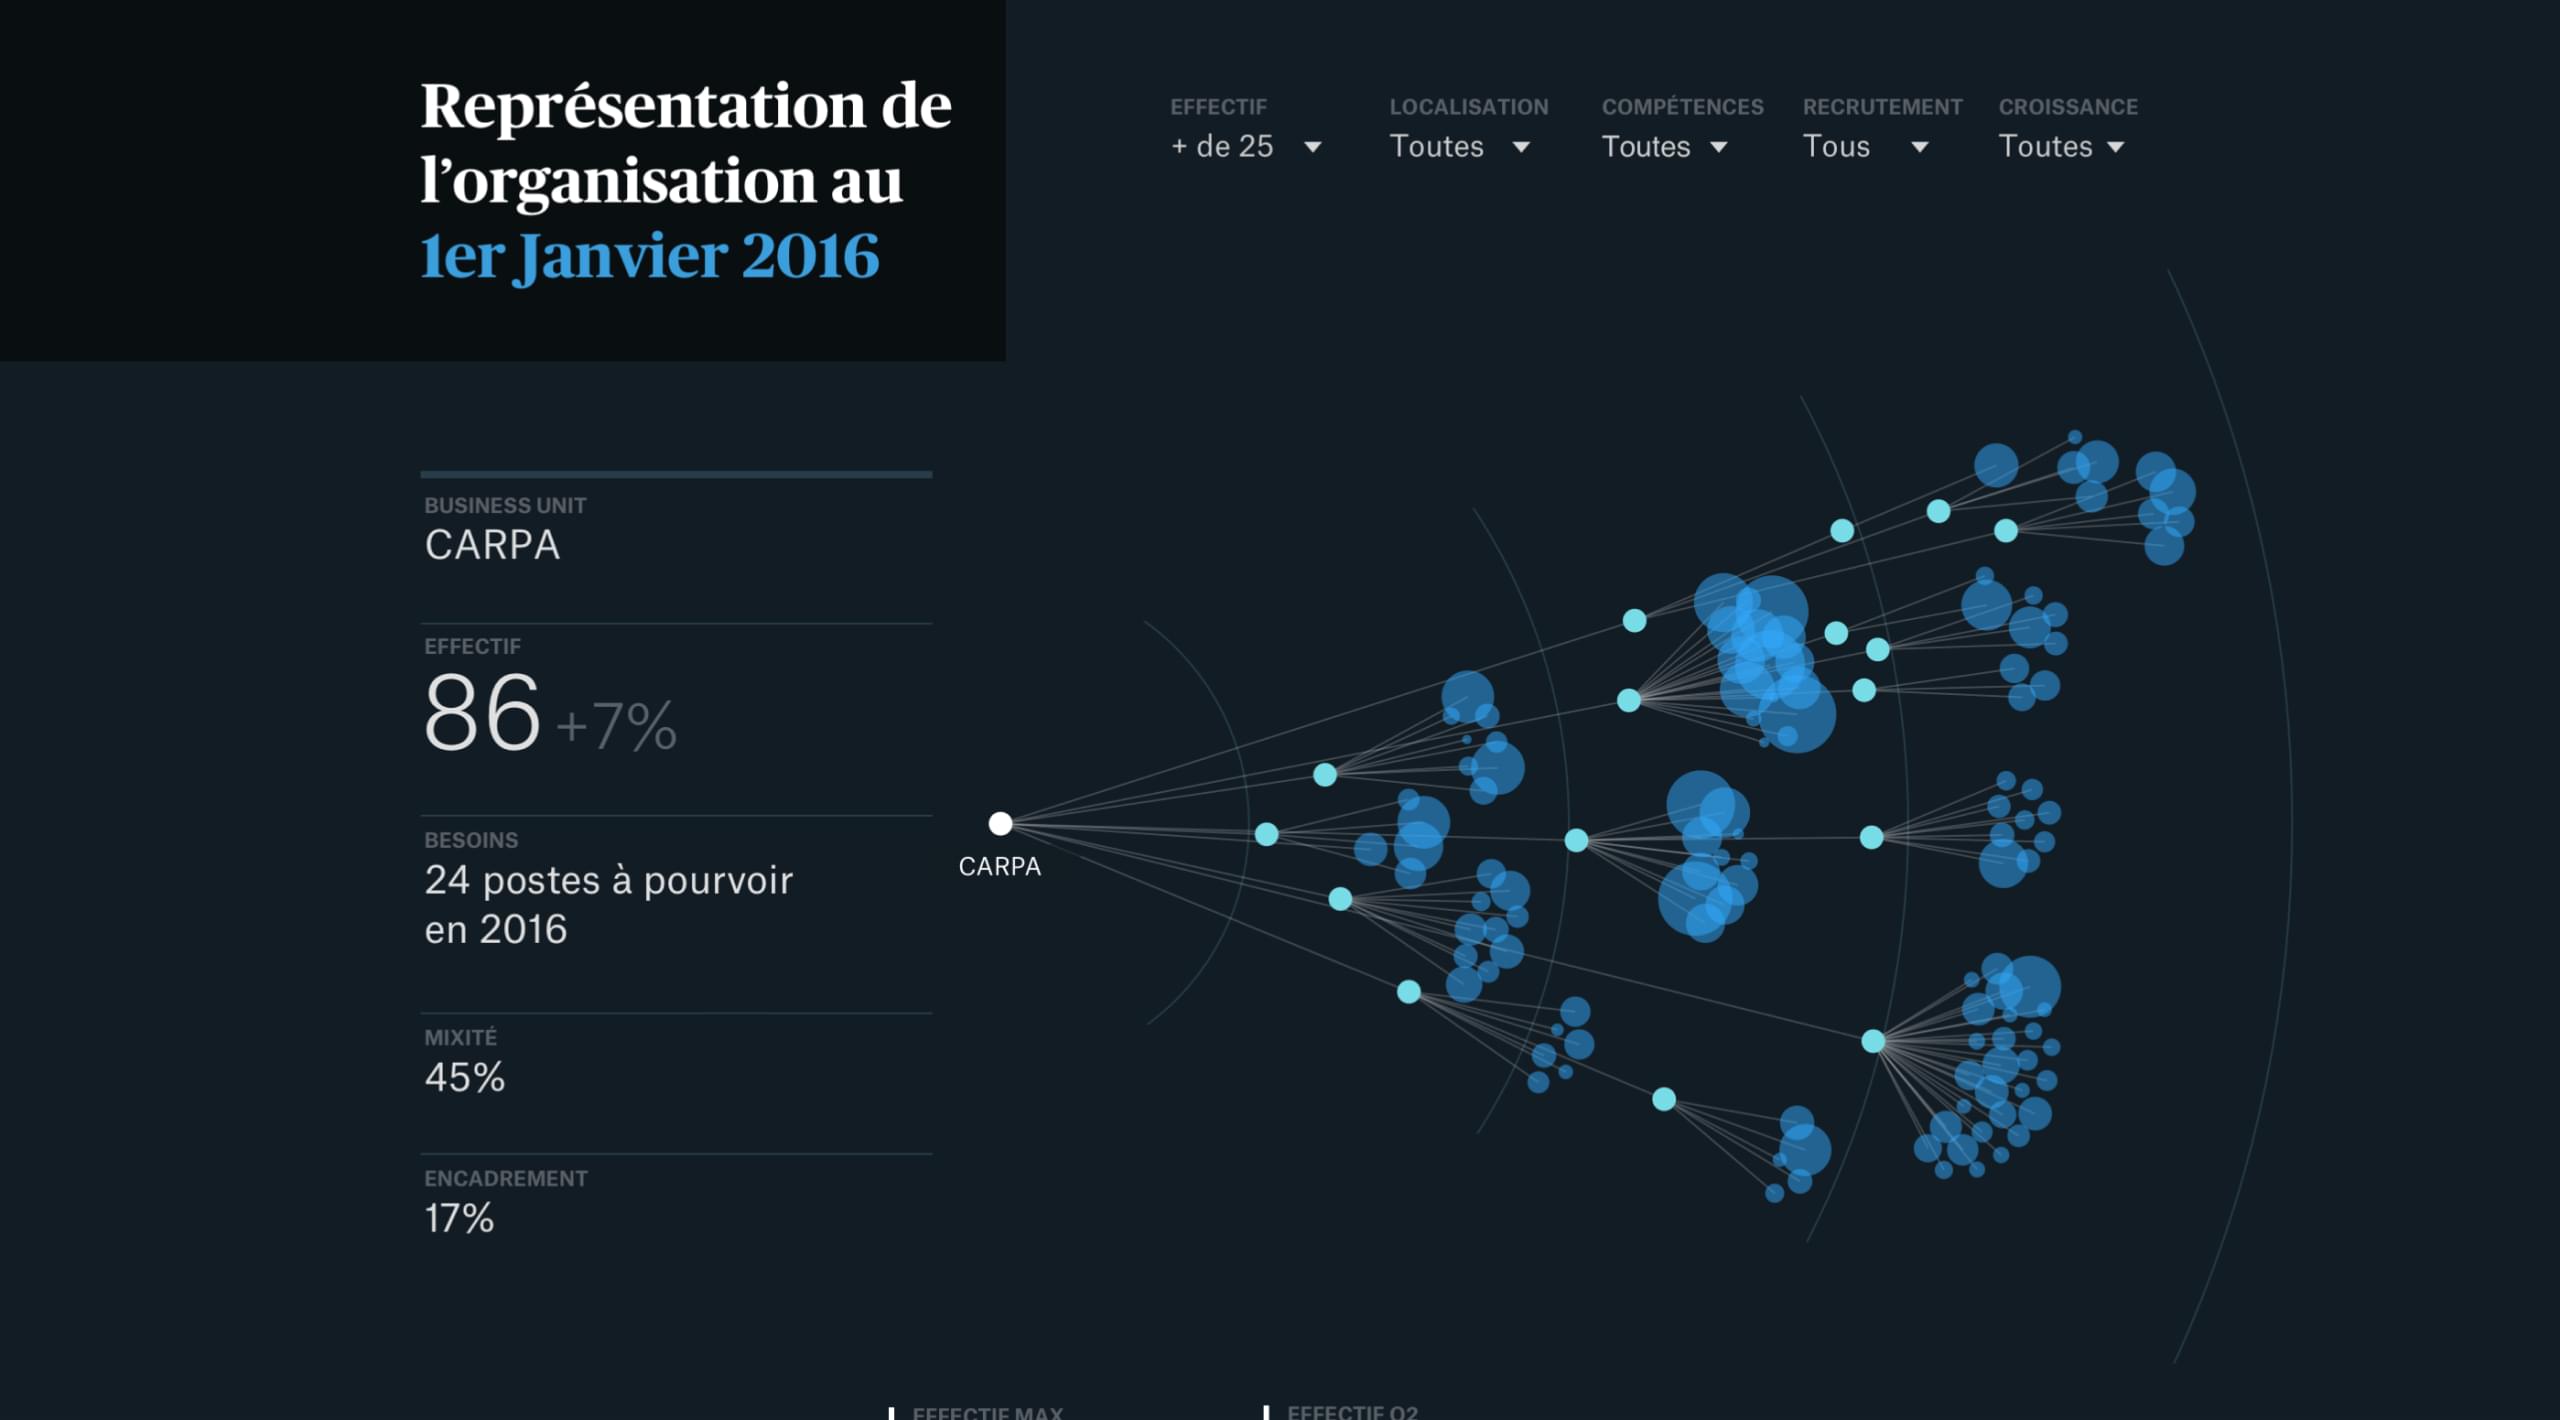
The tool shows the organizational chart in a lively way: each team corresponds to a node, and the links translate the hierarchical relationships.
Data
Job descriptions are a rich source of information to help understand a business: they tell the story of human organization, staff development, changes to professions and career trajectories, etc. Our client had a clean and digitized version of all their job descriptions, making it possible to use them as a database.
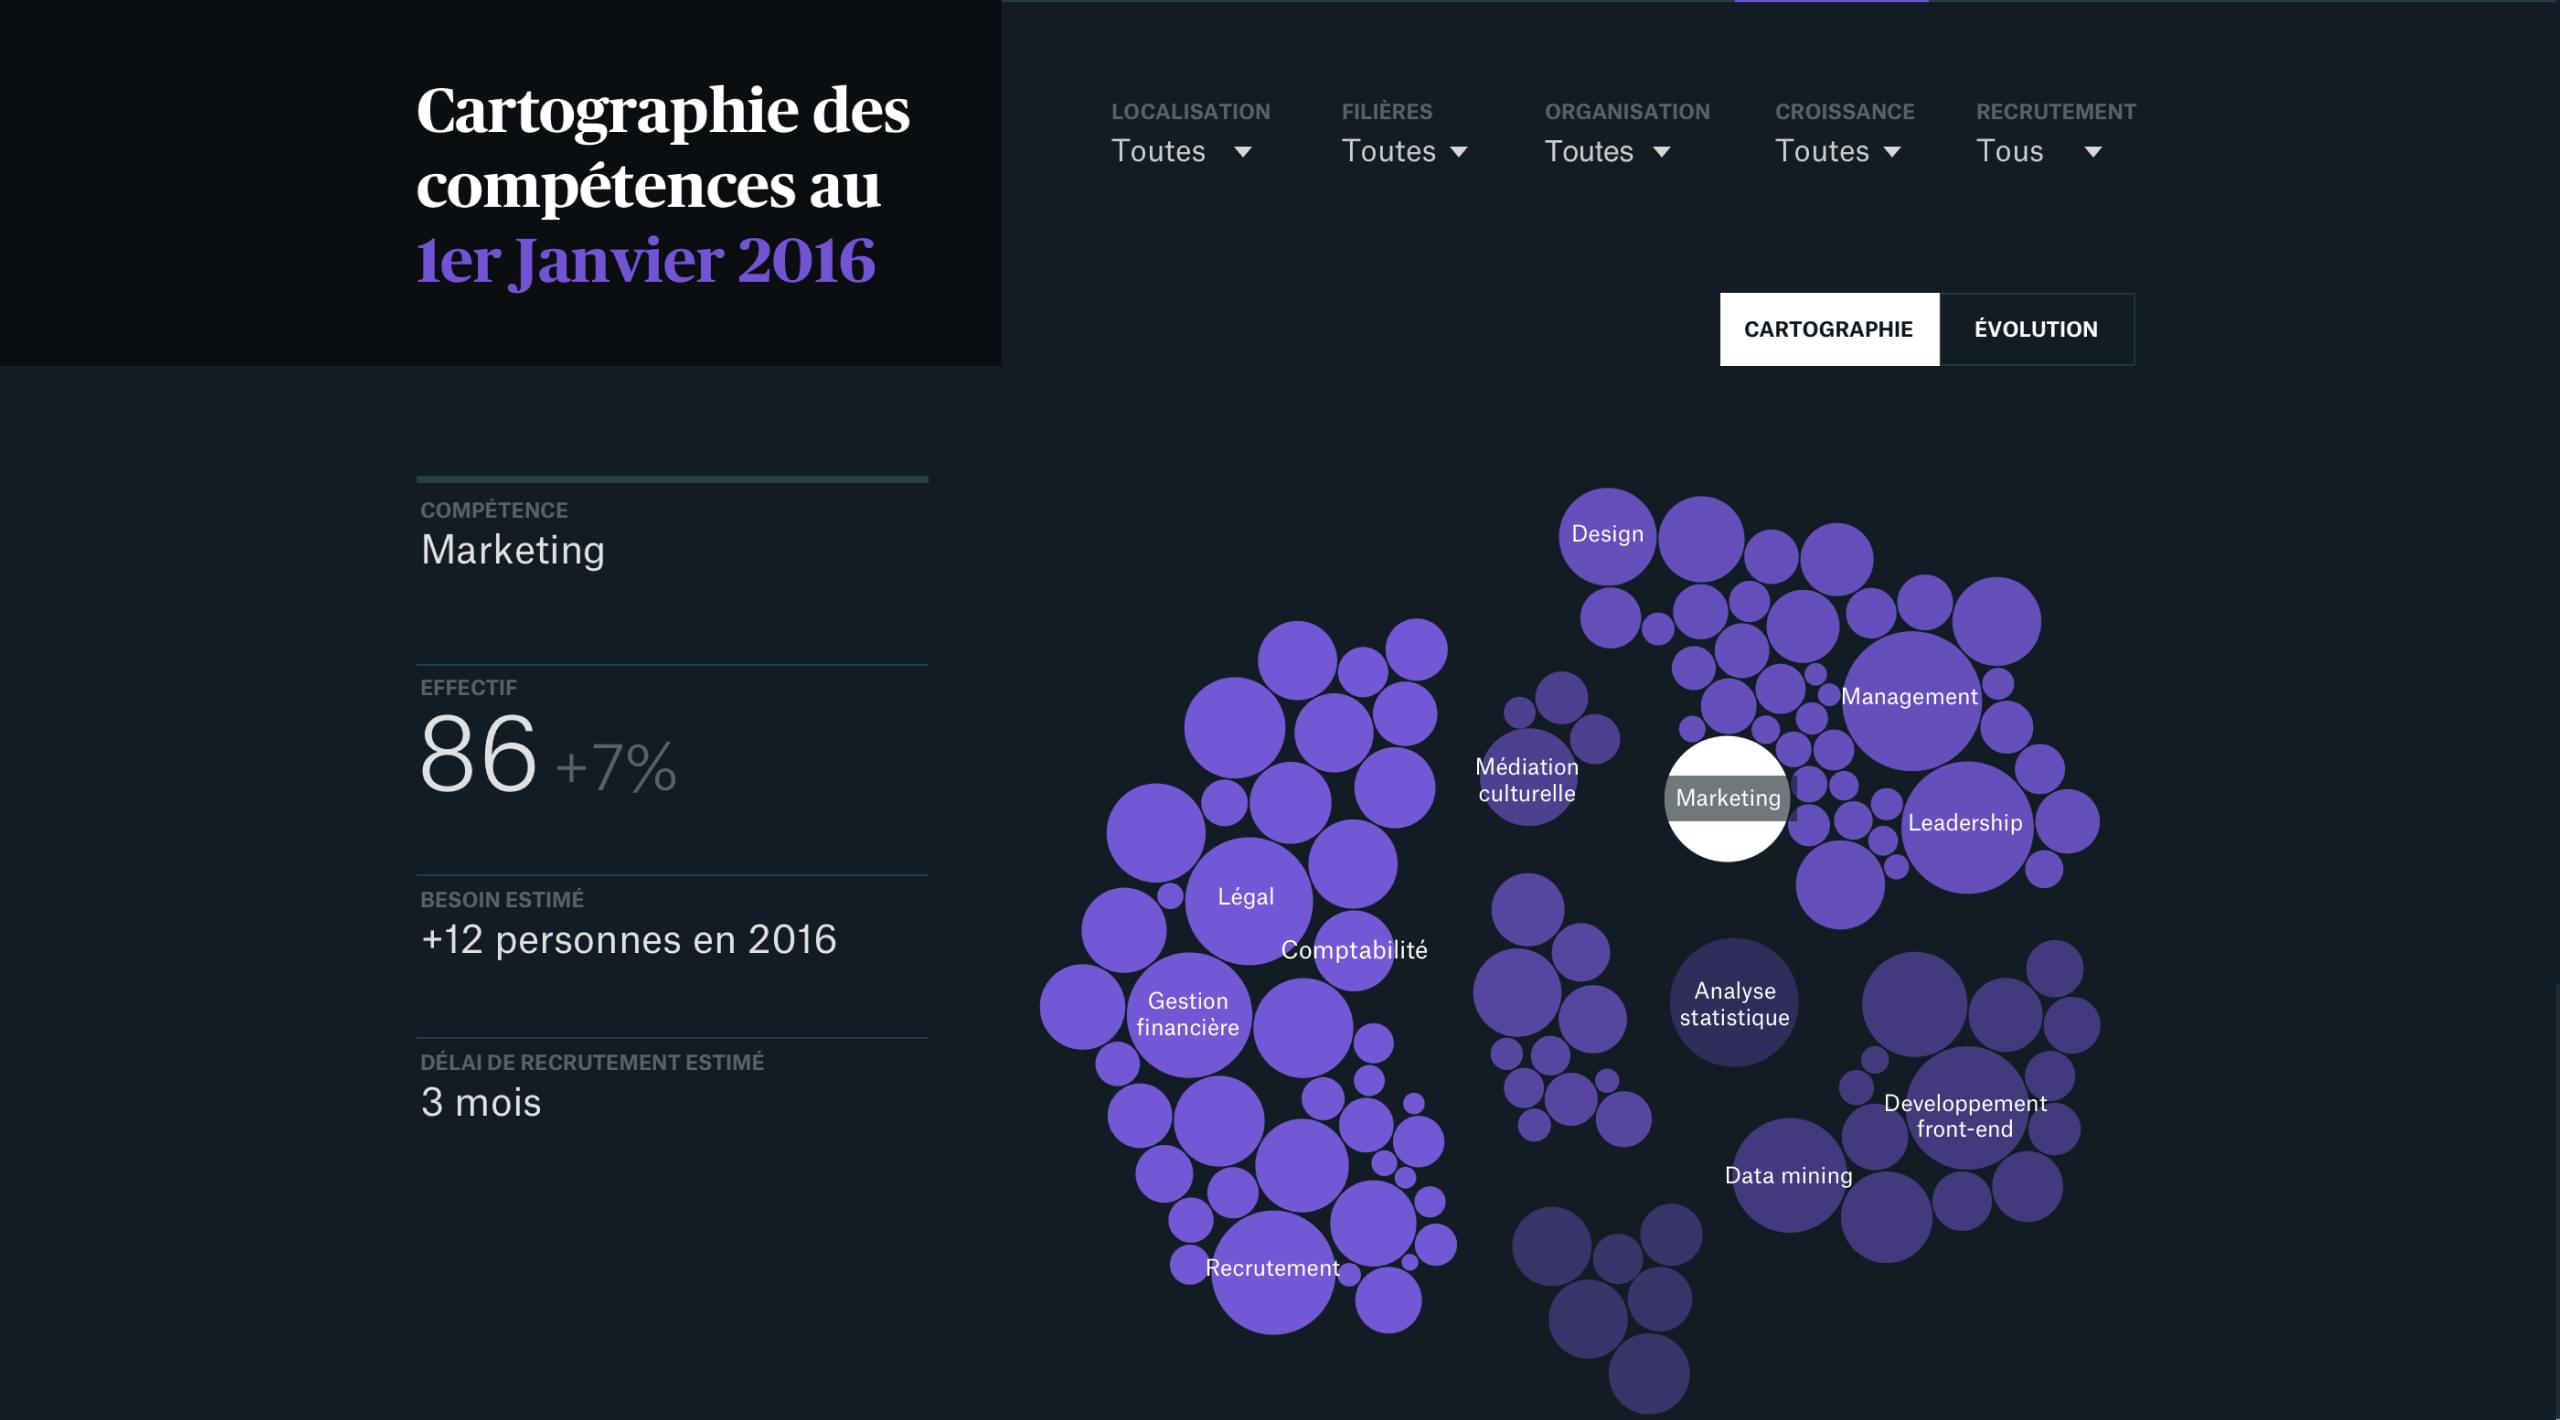
The skills mapping shows all the skills described in the job descriptions, the number of people who have them and their proximity, as well as when several people have skills in common.
Method
We analyzed the data that was drawn from the job descriptions before carrying out around 20 interviews with strategic decision-makers and human resources managers. This initial phase helped us identify where and how the HR data could help decision-making. It also helped us to understand how to visualize this data in order to unlock its potential as an information source.
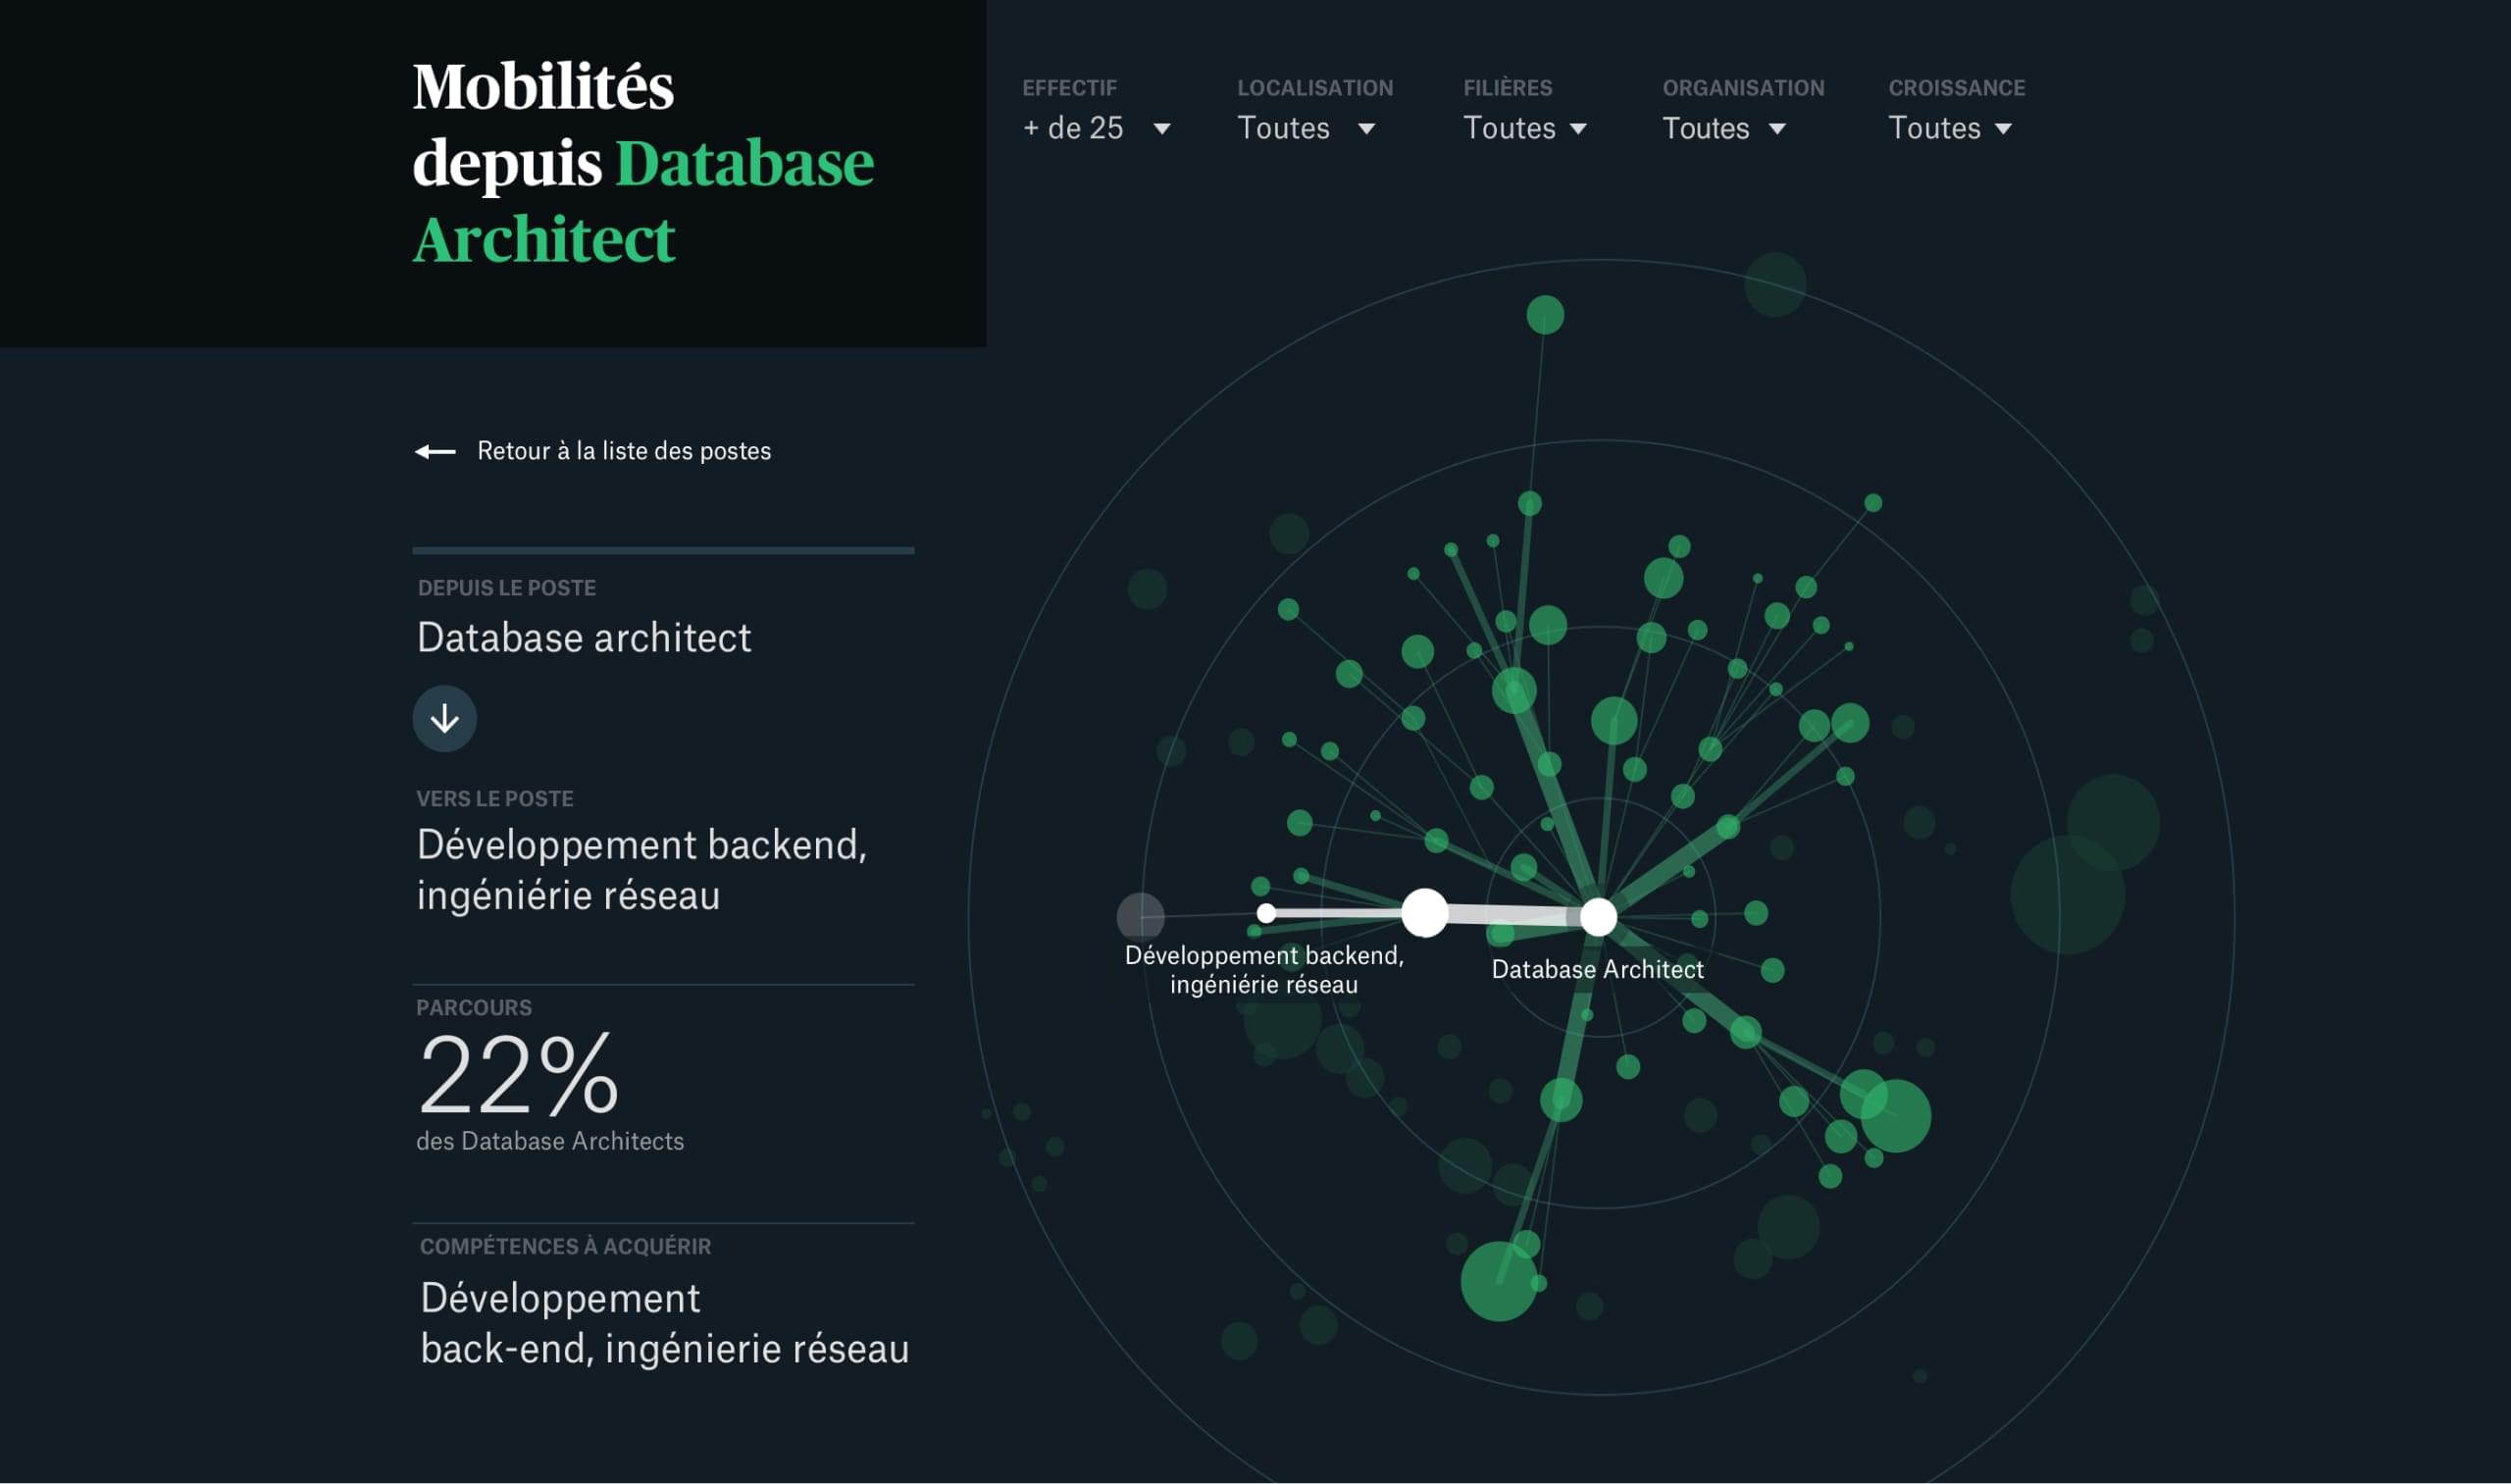
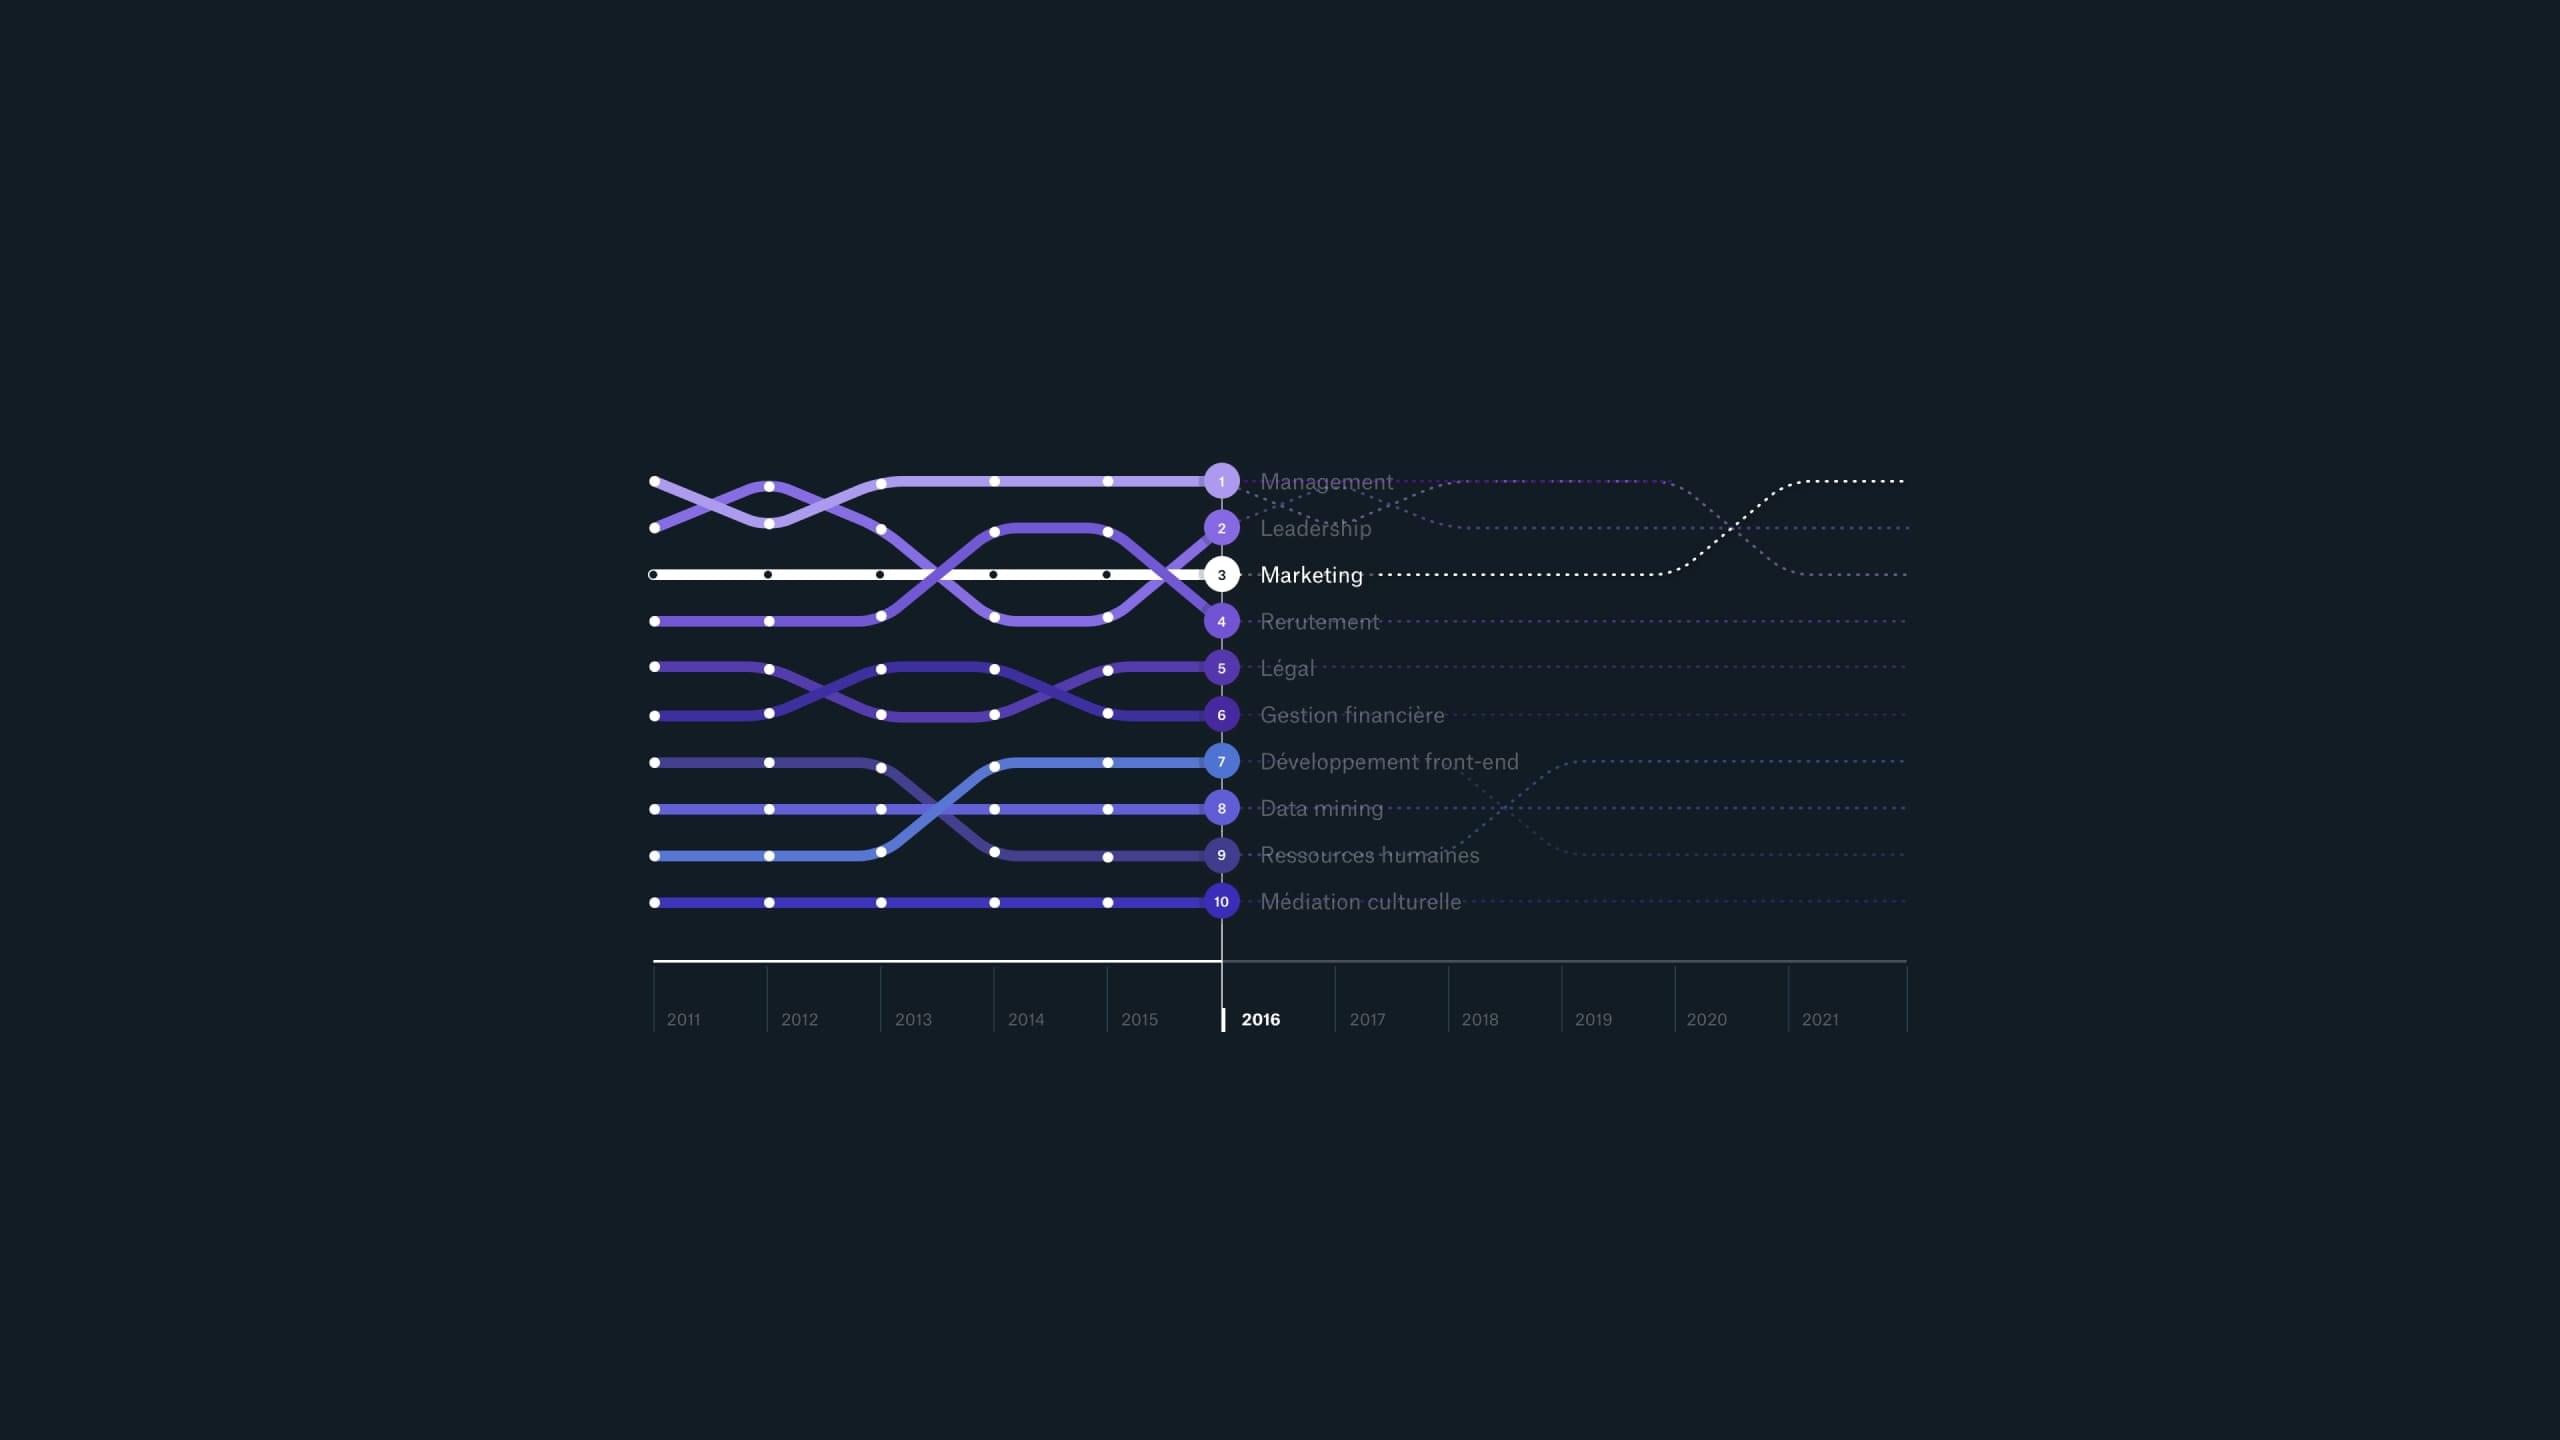
The tool visualizes all the career options at the company, and it shows how it is possible to progress from one job into other roles.
Solution
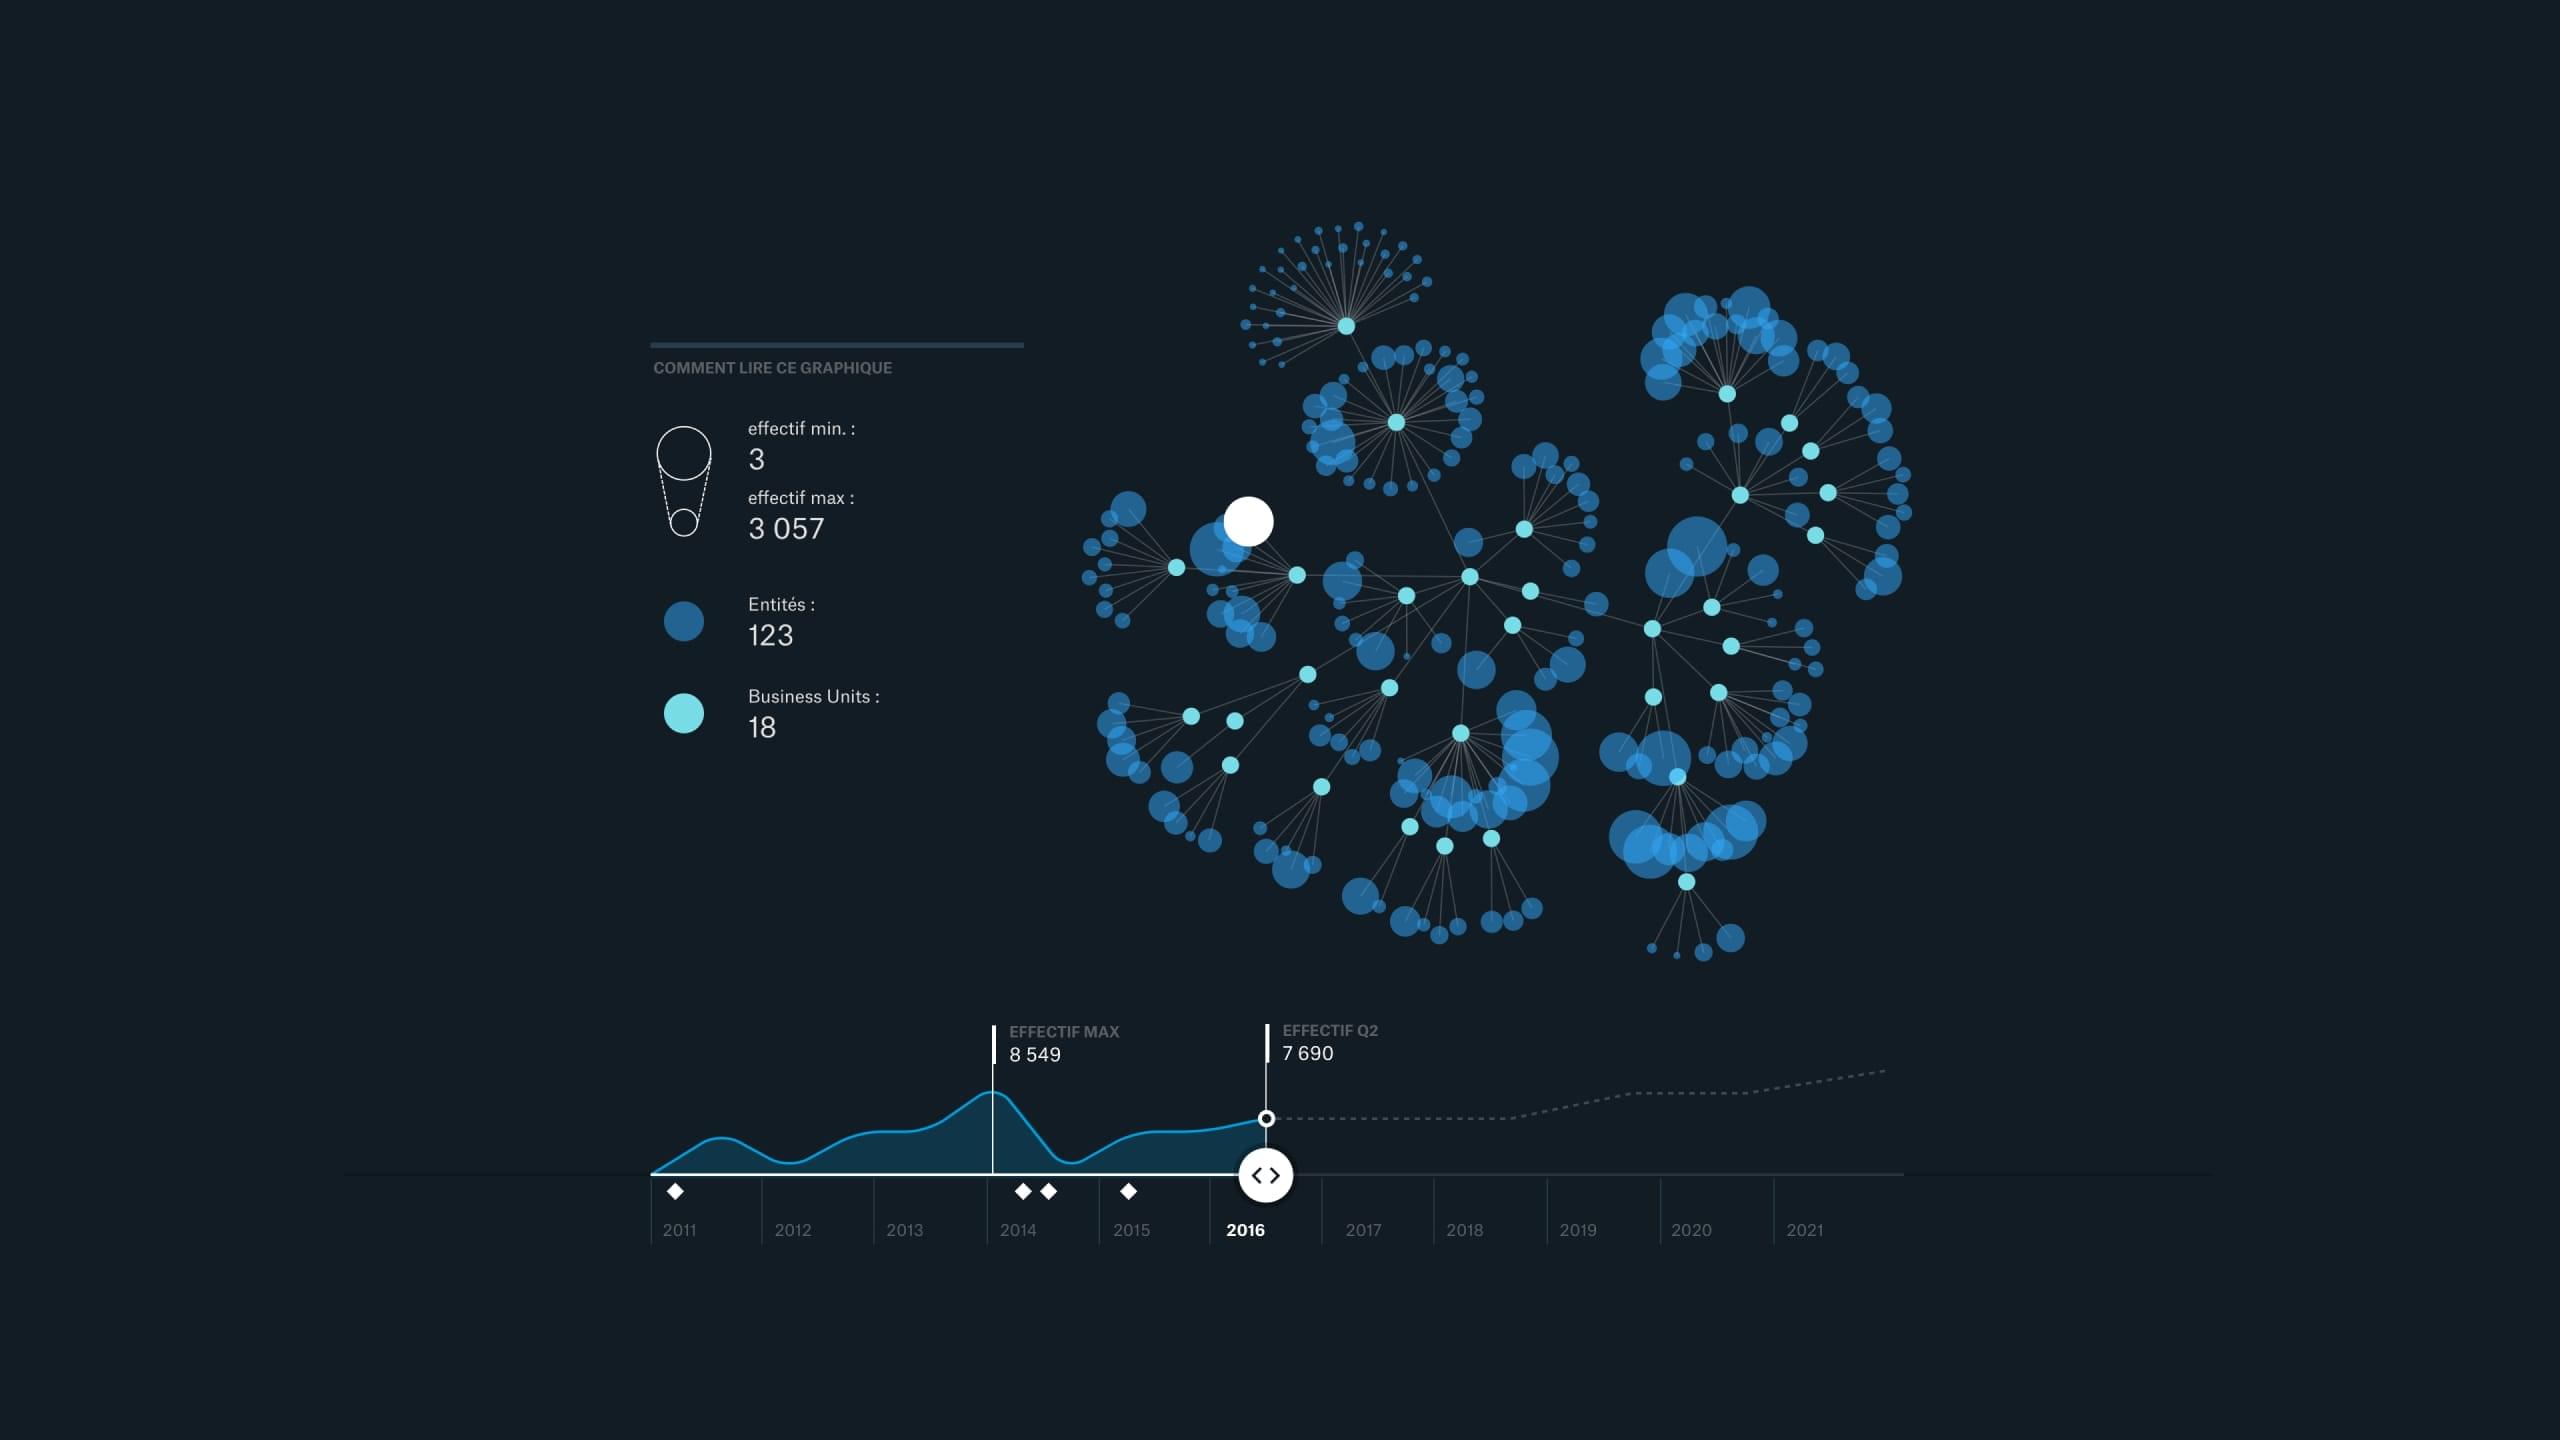
The tool we produced uses data visualization to help the organization’s leaders to understand the changes in their business from different points of view: changes in skill sets, changes in jobs, changes in recruitment needs, organizational development, etc. Thanks to its visual and interactive dimensions, the tool reveals the company’s evolution. It helps its users to project the impact of their future decisions, and provides a framework for their strategic choices.
Highlight
In addition to the ability to process large data histories, the tool highlighted the importance of data visualization as an HR decision support mechanism.
Subscribe to our newsletter:
75010 Paris
France