Bitcoin Blockchain Visualizer
Explain the basic concept of the Bitcoin blockchain by visualizing it in real time.
Date
2017
Results
The visualization was projected in front of thousands of spectators during the September 2017 edition of Live Magazine at Casino de Paris.
We designed and developed an ambient visualization to explain the Bitcoin blockchain, and to show viewers its transactions and blocks. It makes the pace of blockchain more visible and demonstrates the creation of new blocks and the absorption of transactions within them. This project showcases our vast skill sets to show how an aesthetic visualization can help explain complex concepts.
Problem
Cryptocurrencies and blockchain are still largely obscure concepts and they can be difficult to make accessible to mainstream audiences. How can we help people to better understand these concepts and what information can we use to make this possible?
Data
We developed a server connected to the Bitcoin API by initiating our own Bitcoin node on the network. Thanks to this server, we were then able to retrieve all blockchain events—such as the creation of blocks and unconfirmed transactions—in real time.
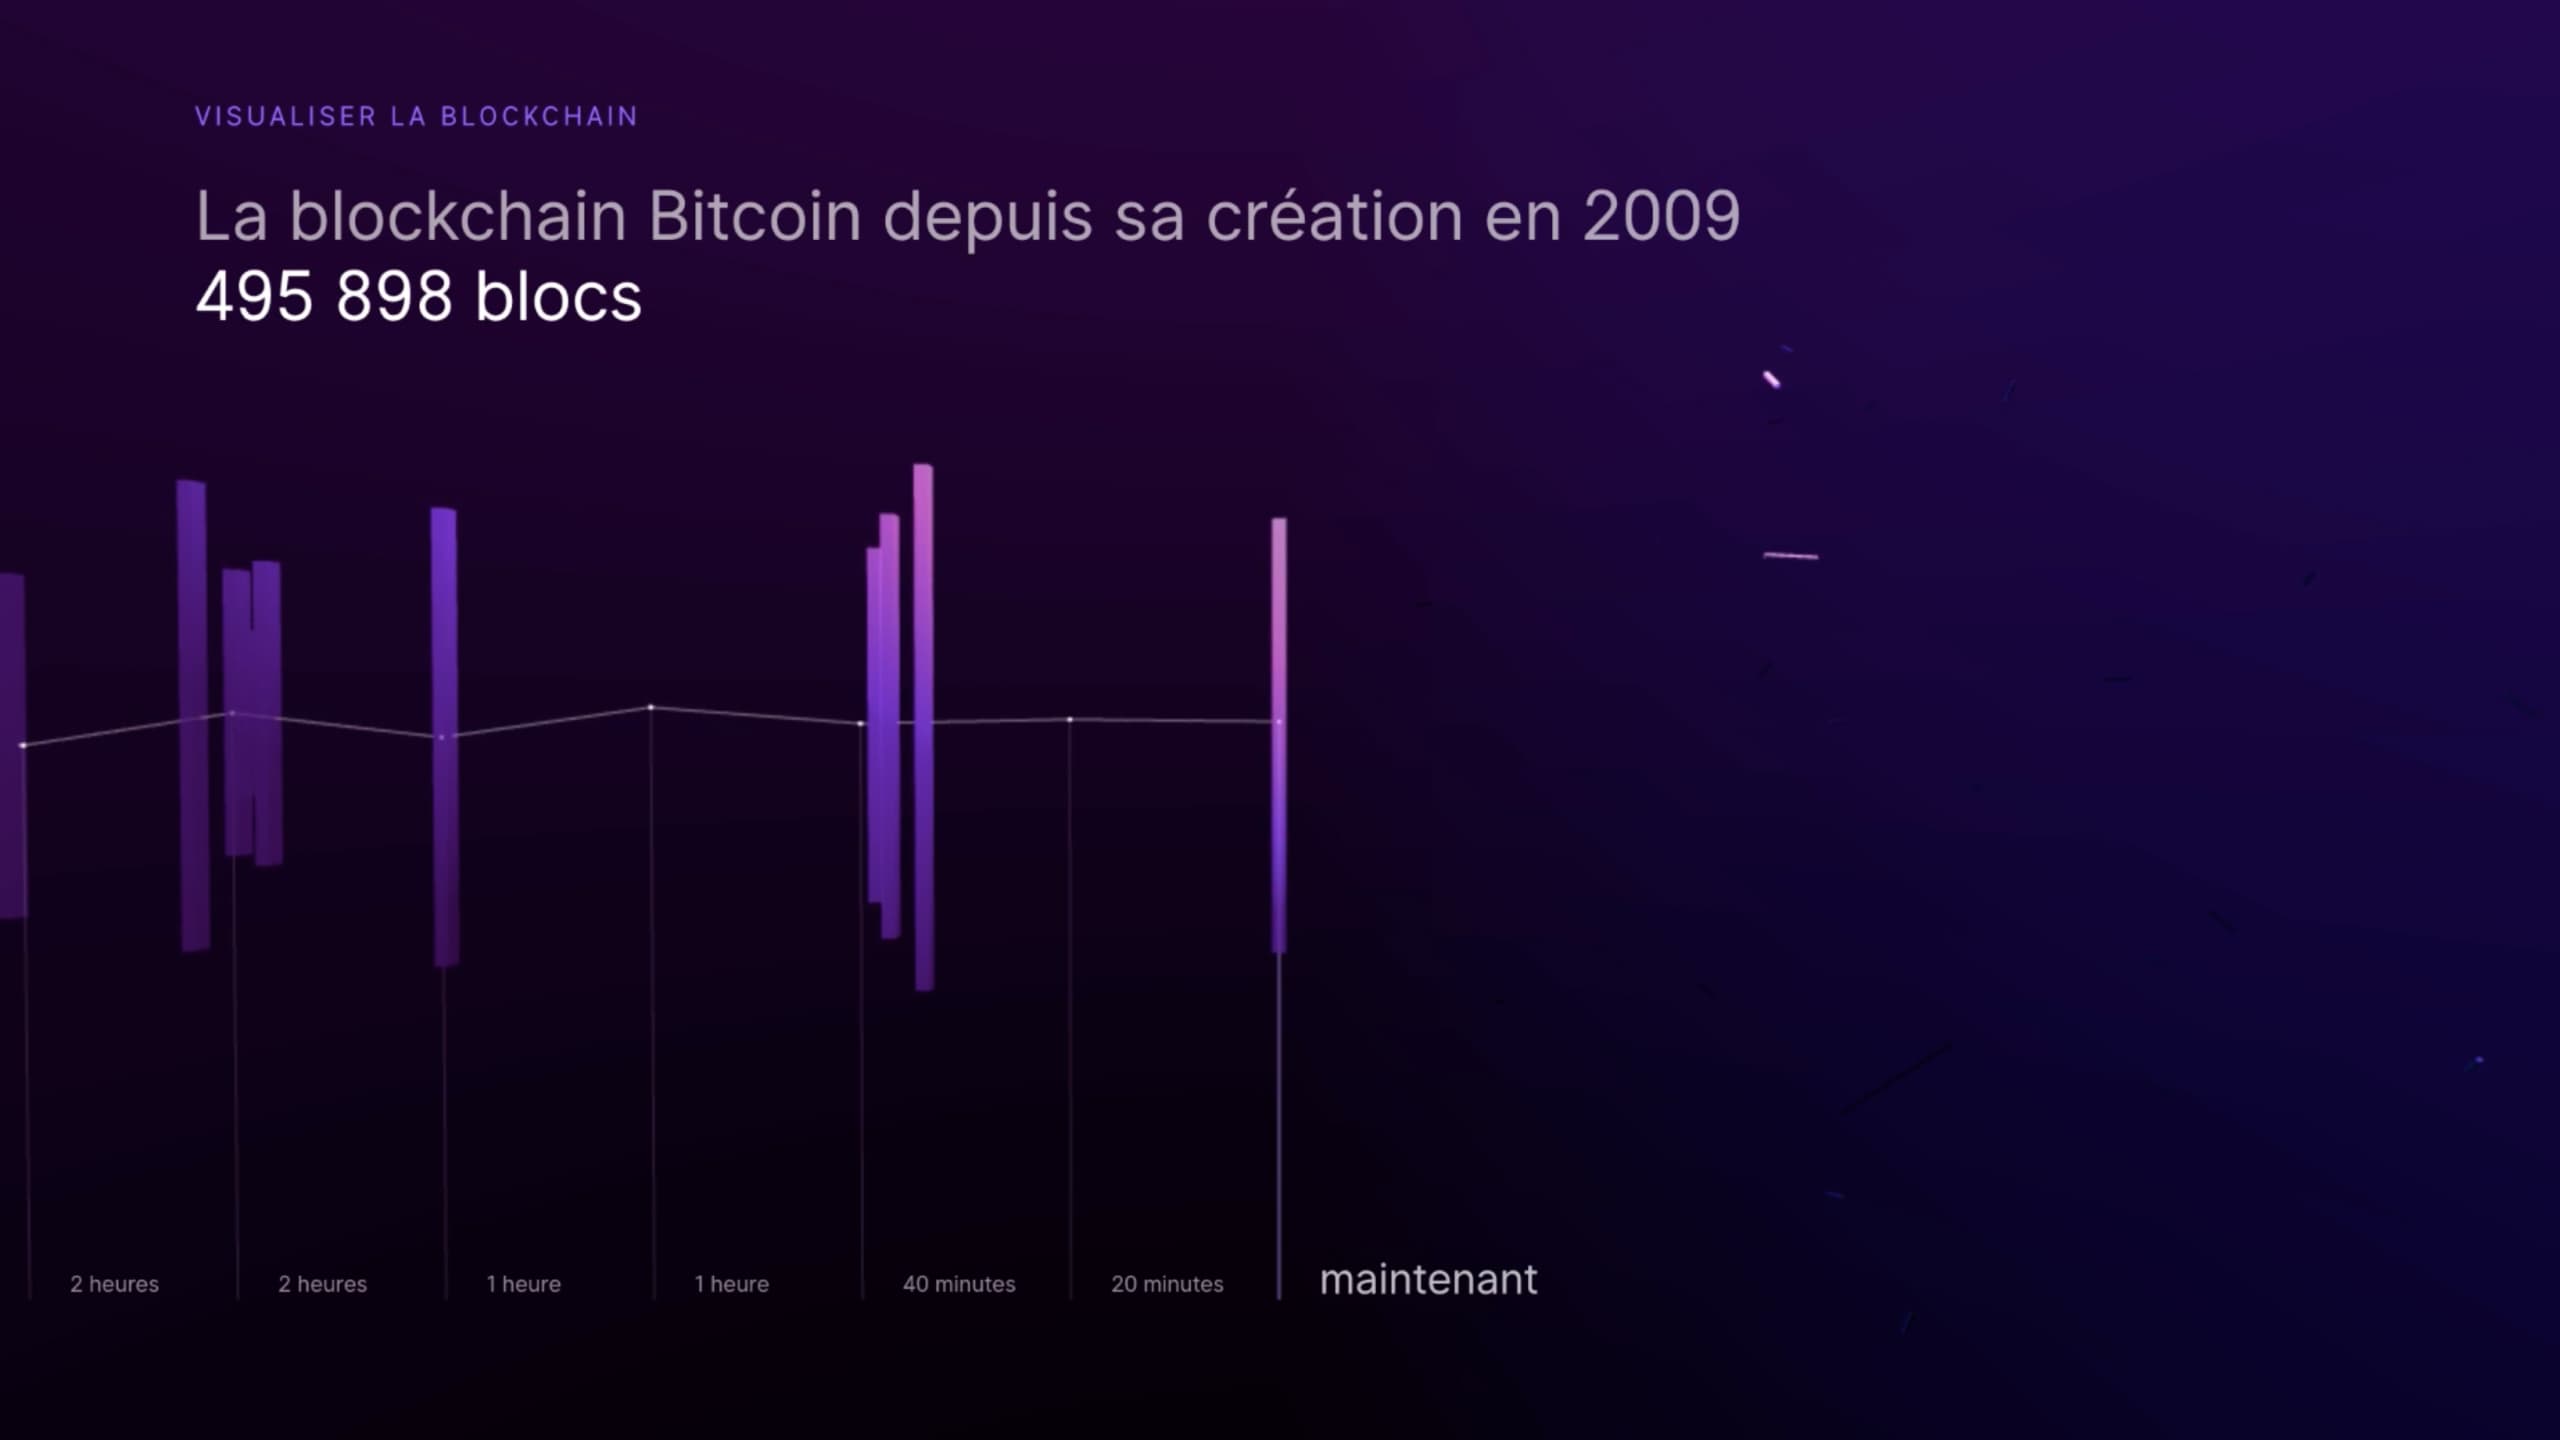
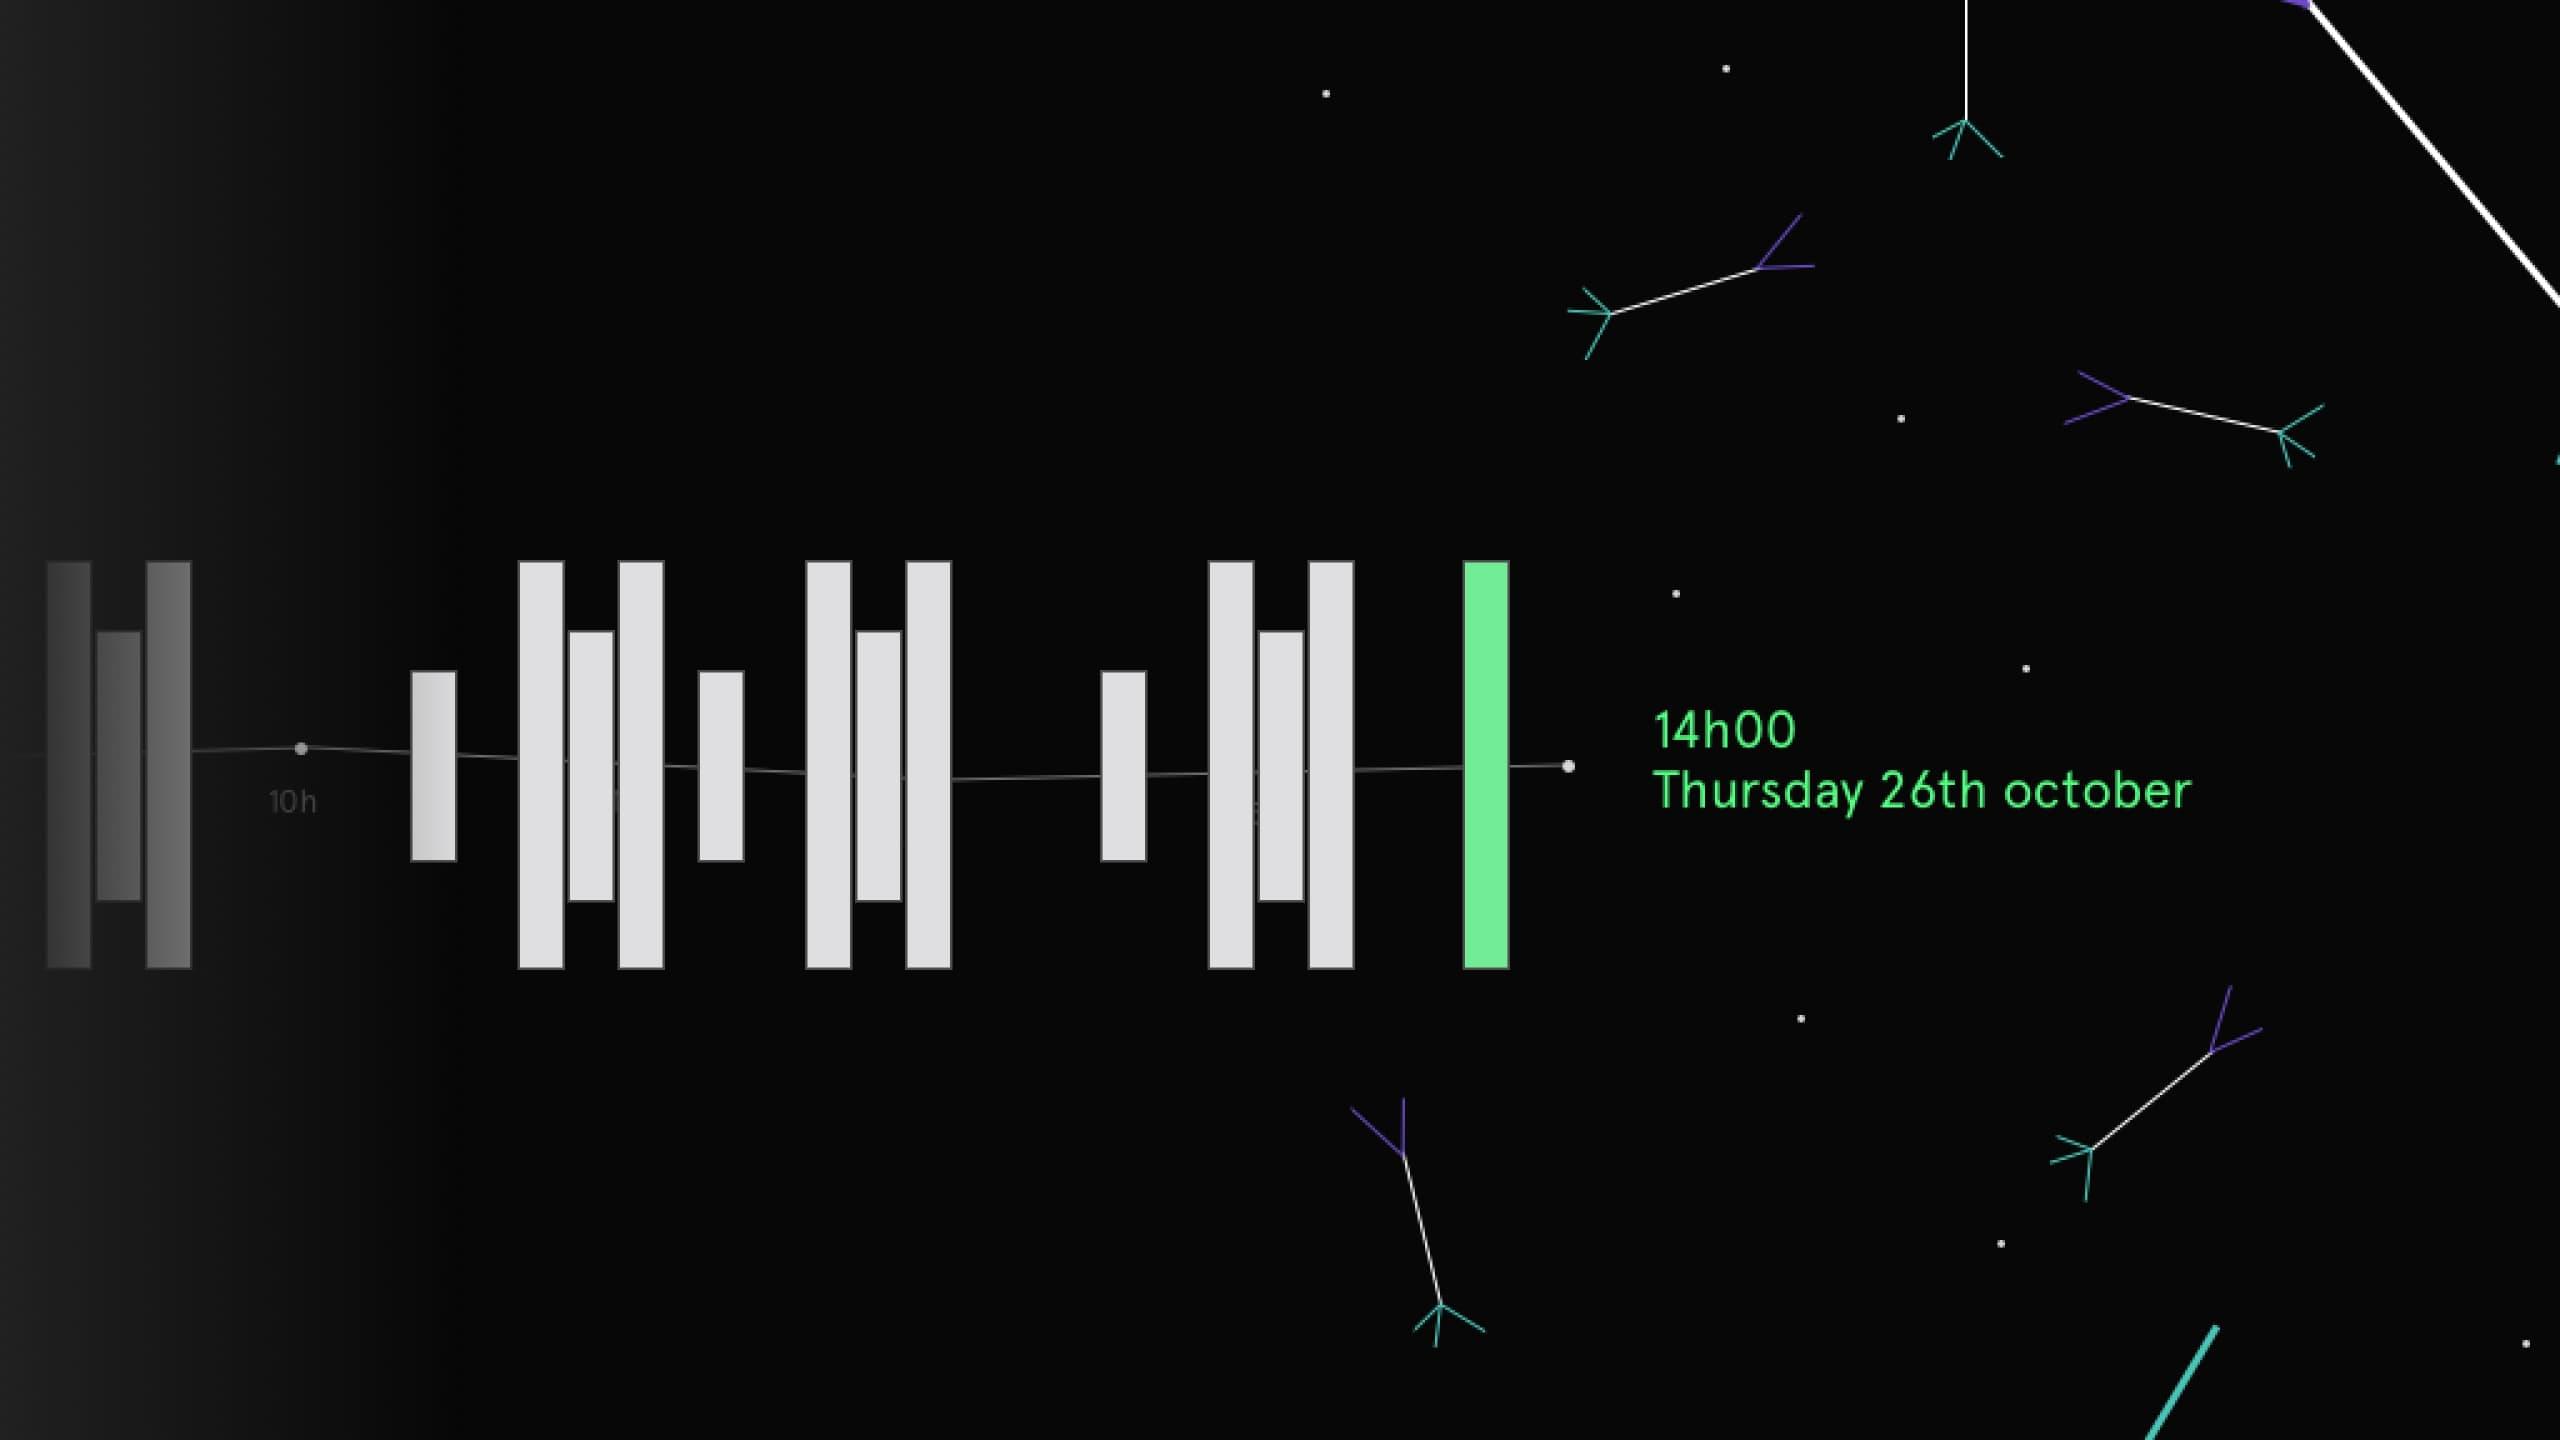
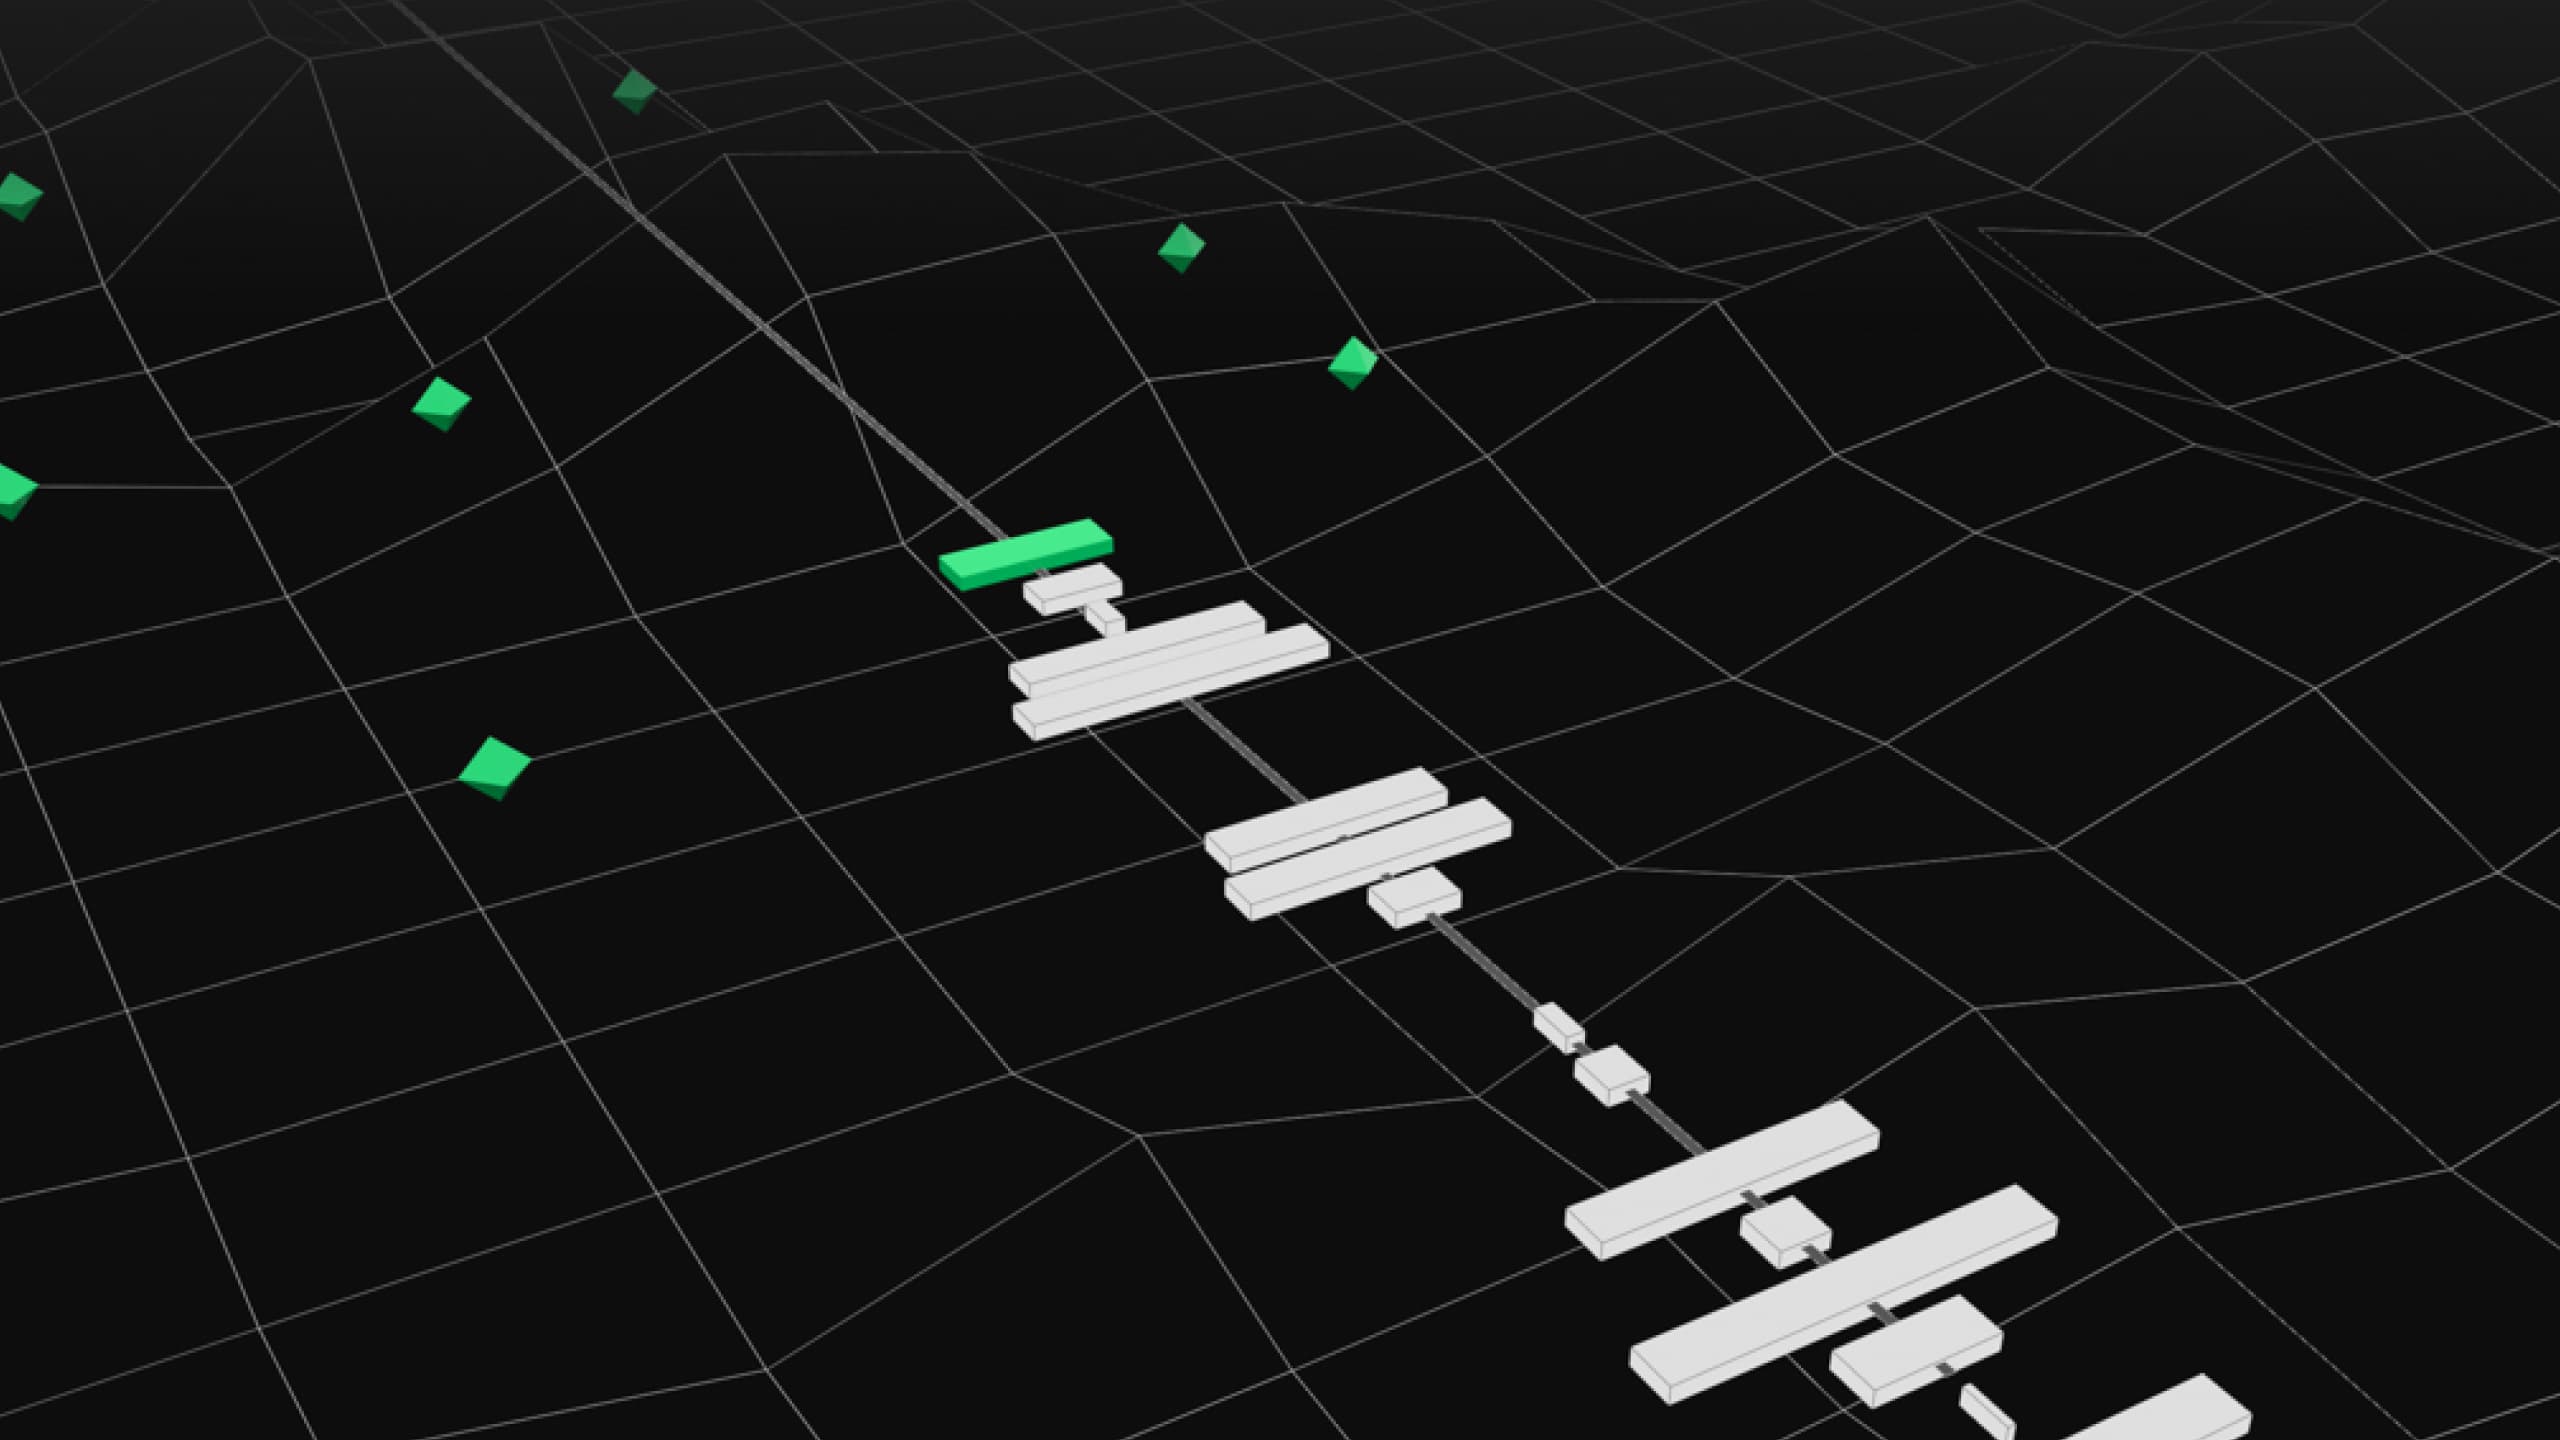
Each vertical bar represents a block in the Bitcoin blockchain. The blocks are sorted in chronological order, the most recent on the right and the oldest on the left.
Solution
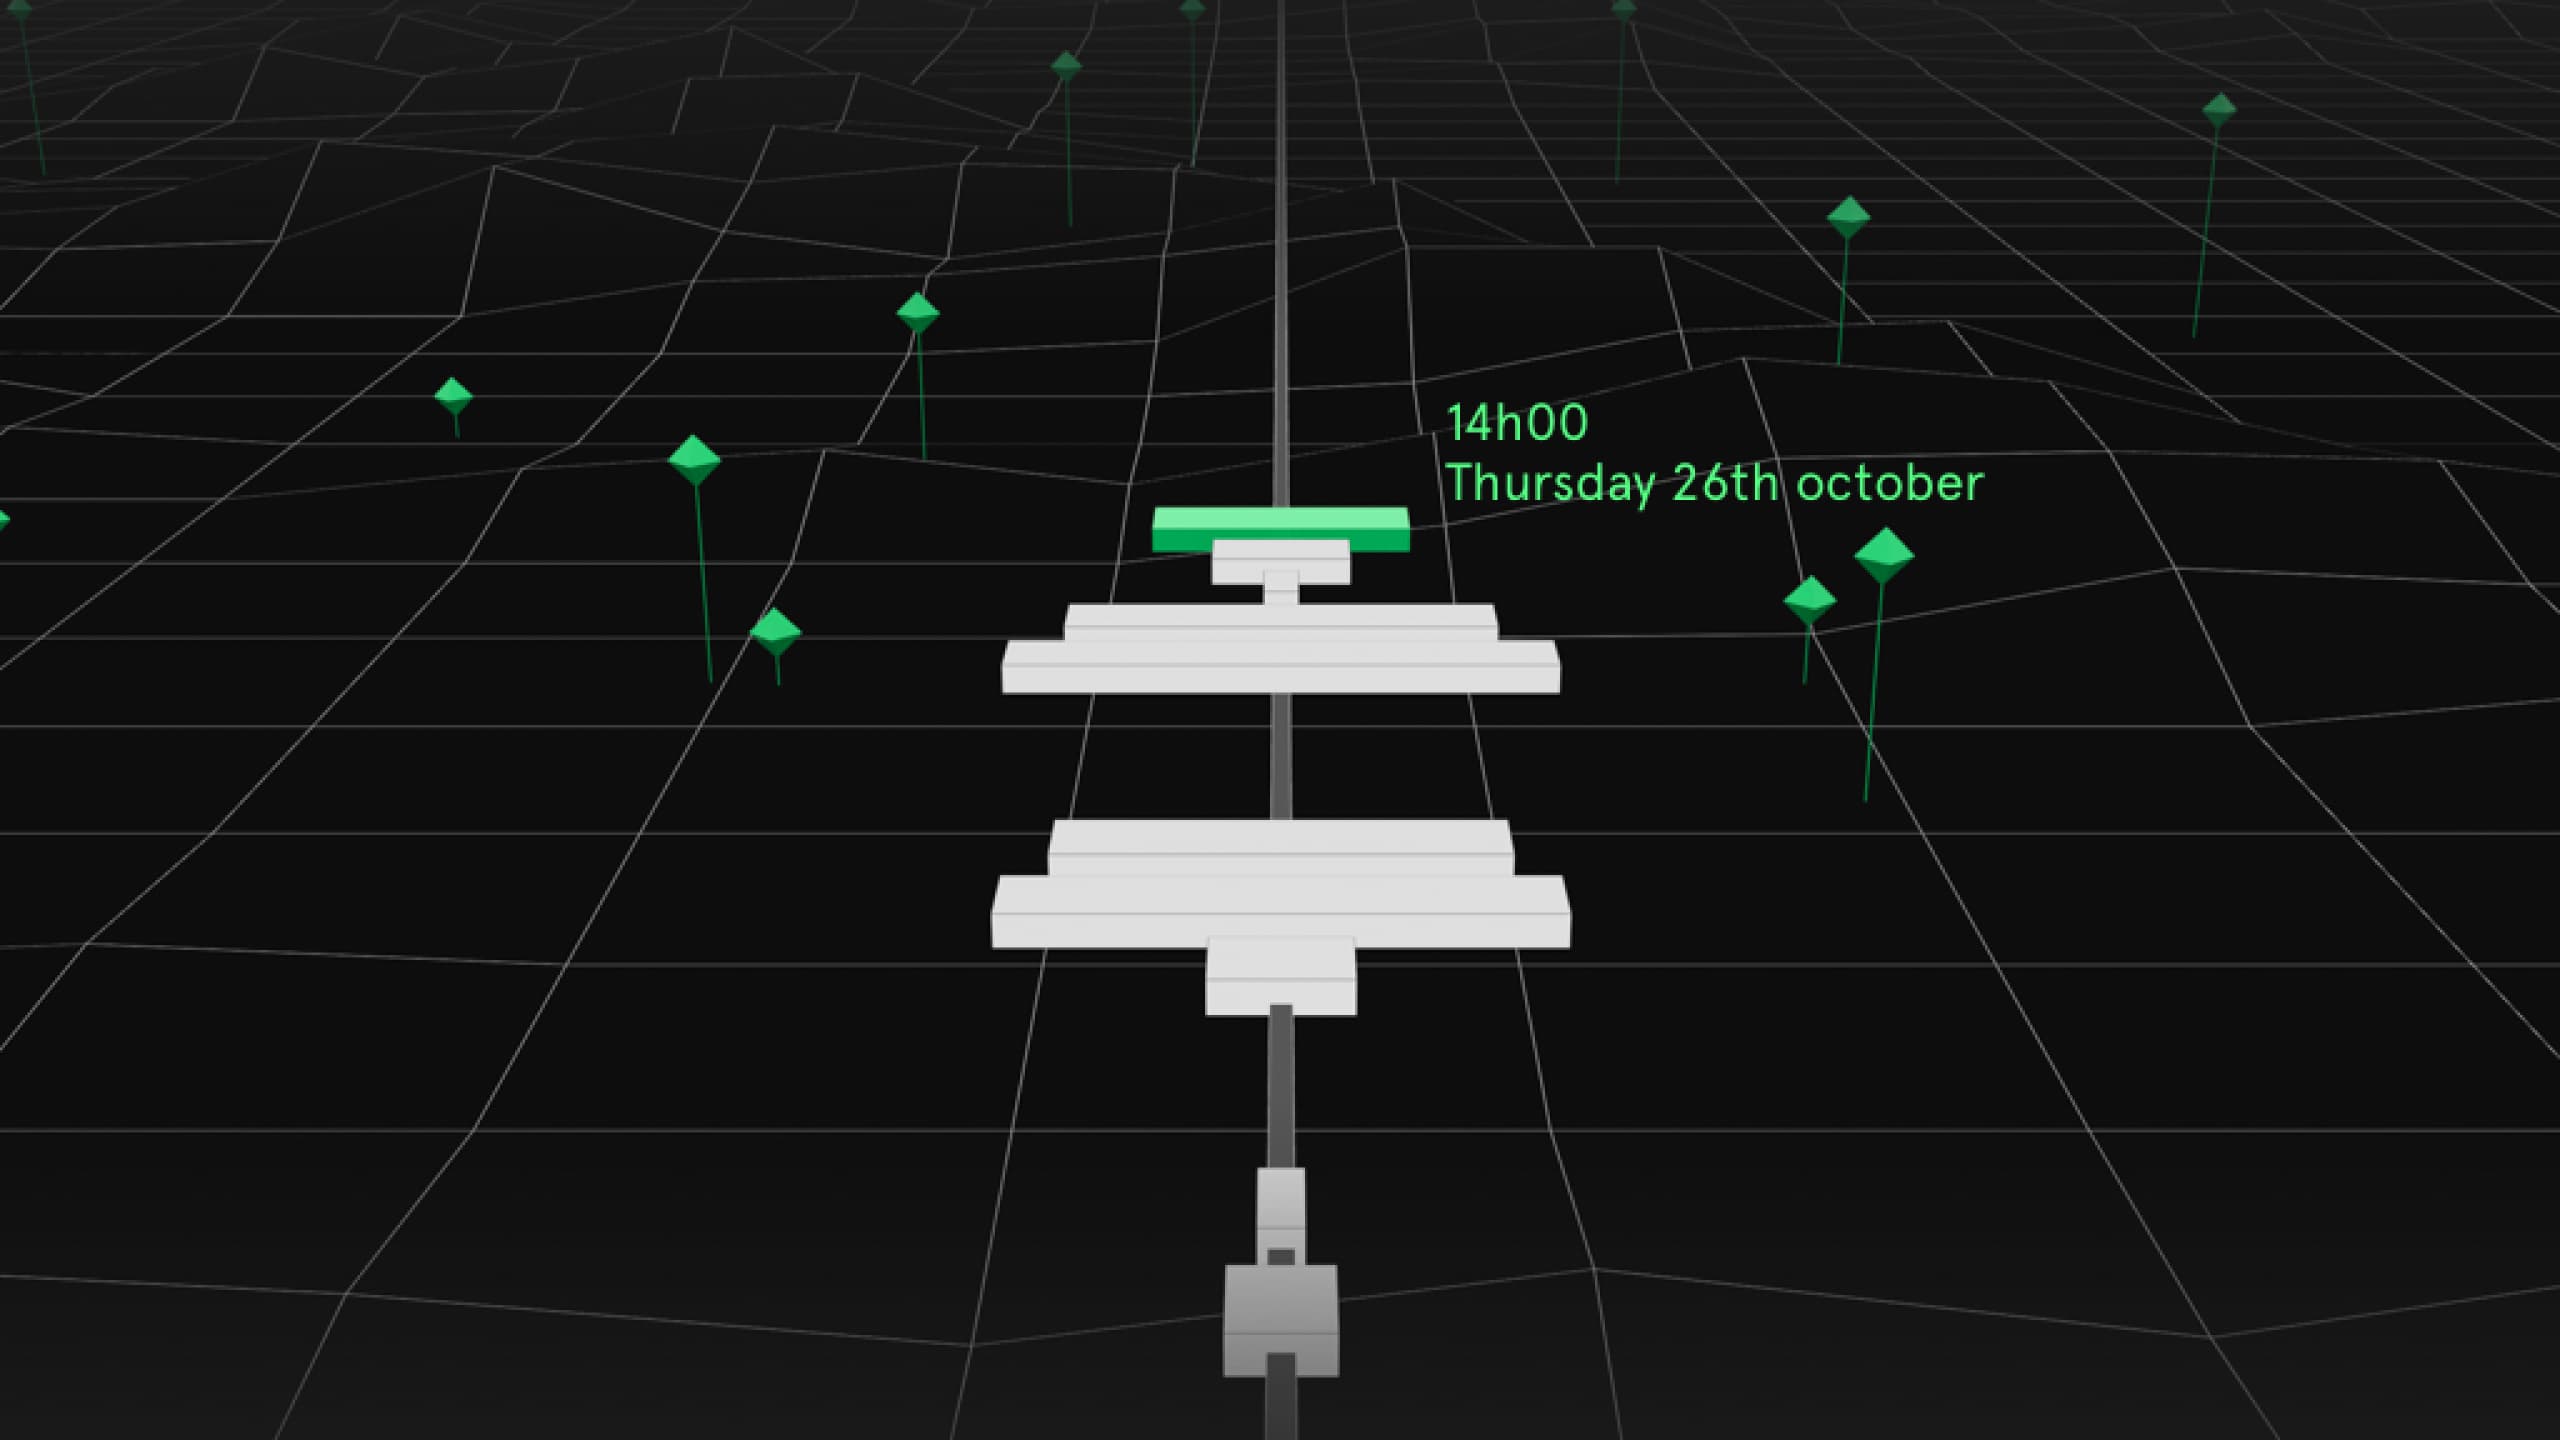
We had to make our visualization all the more attractive given that cryptocurrencies and blockchain are little known subjects. That’s why we developed an aesthetic 3D visualization showing only part of the blockchain and its concepts. We combined a careful design with our technical expertise and our experience simplifying complex problems to make the blockchain world more tangible and accessible.
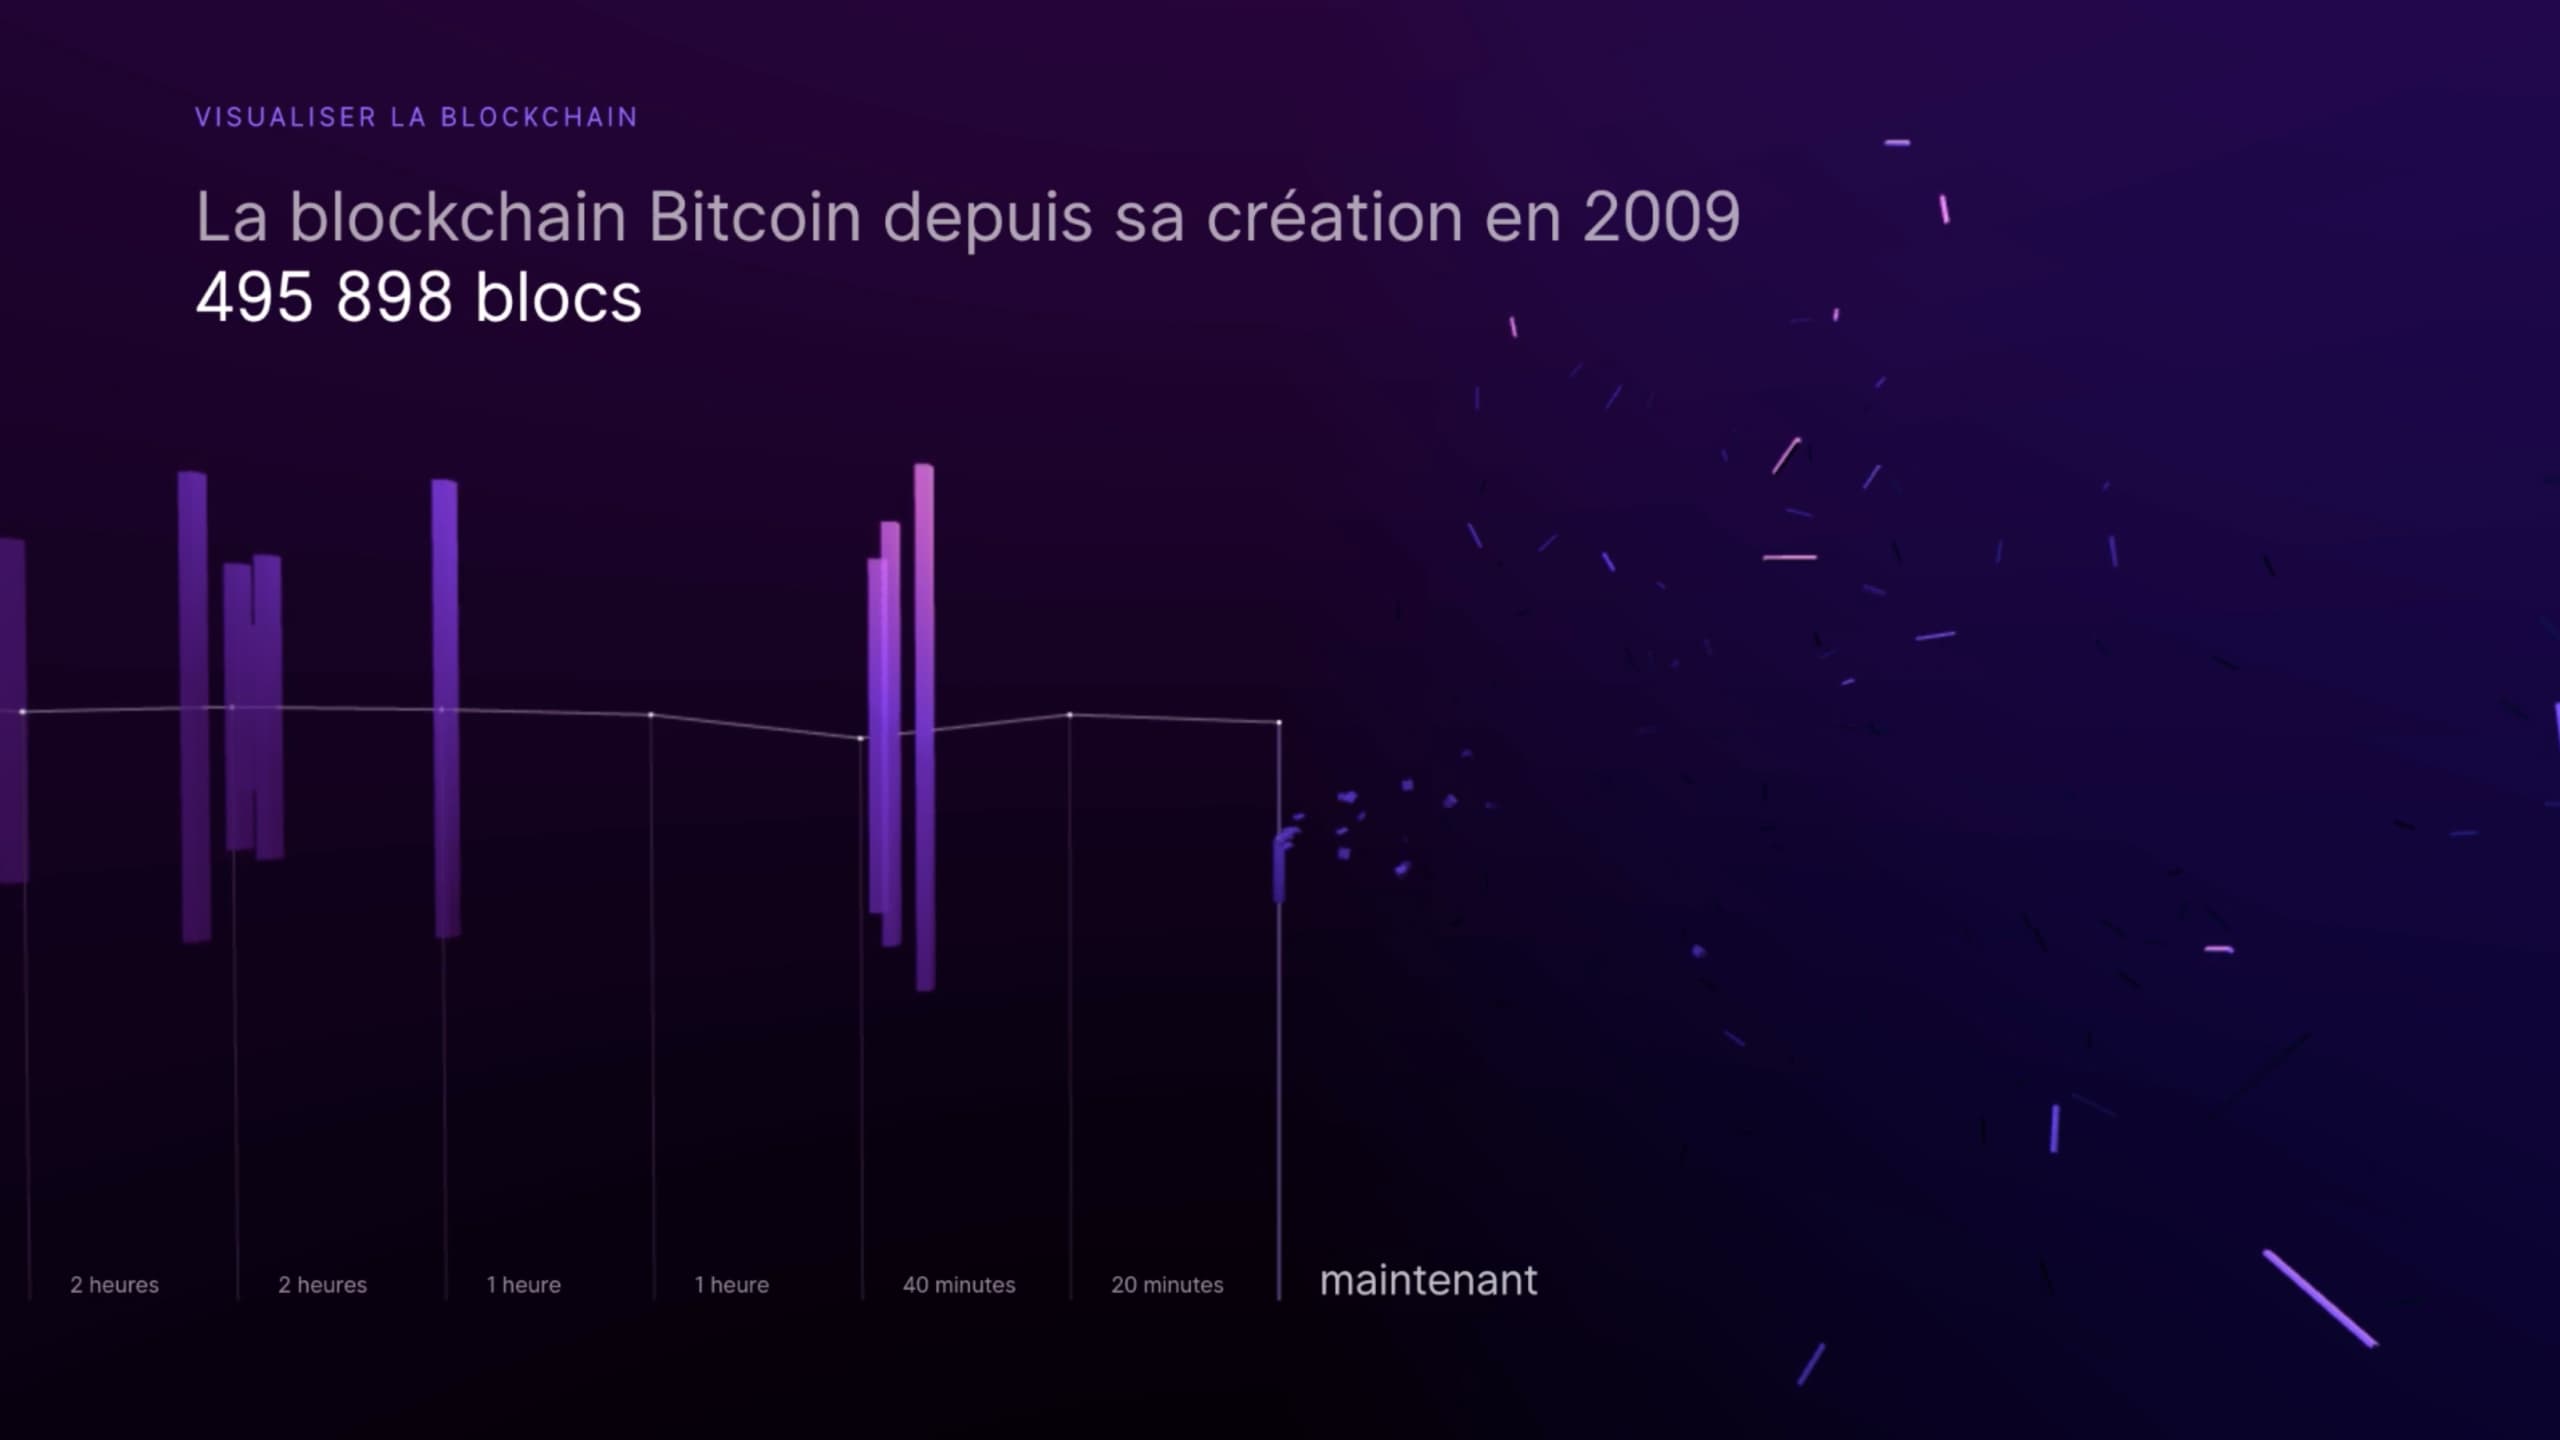
While waiting for a new block, unconfirmed transactions accumulate in the form of particles on the right-hand side of the screen. As soon as a new block is created, these transactions are absorbed and disappear by way of an animation.
Highlight
The visualization was designed for a one-off event—a 10-minute conference at Live Magazine—and it had to be combined with an oral presentation. We took a screen recording of the app at a key moment and synchronized this with the conference script to help reinforce understanding of the visualization alongside the oral explanations.
Subscribe to our newsletter:
75010 Paris
France