Prototype
Thermal Comfort Analyzer
Make people feel the thermal comfort of a home from physical simulation data.
Client
Saint-Gobain R&D
Date
2018 - 3 months
Results
Used by Saint-Gobain to advance research on the representation of thermal comfort as part of their Multi-Comfort Buildings initiative.
Saint-Gobain Research Paris entrusted us with the creation of a prototype highlighting the thermal comfort provided by its roof insulation. It was part of an initiative to improve brand awareness for the product. We combined our know-how in interaction design with our 3D and algorithmic skills to deliver a useful, enlightening and innovative data visualization application.
Problem
Thermal comfort is a difficult concept to visualize because it is multifactorial and subjective. It is ordinarily a feeling that depends on the temperature felt, the wind, the orientation, and even the physiology and psychology of the individual. Saint-Gobain challenged us to find an innovative and convincing visual representation of thermal comfort that was capable of conveying these parameters.
Data
Saint-Gobain Research Paris provided us with simulation data for a social housing property in Brazil, where the company markets insulating materials. Each of the four rooms in the house was cut into 125 small volumes, each associated with perceived temperatures. External parameters then supplemented this data: date, time, external temperature, orientation of the house, insulating materials, etc.
Method
Thermal data visualization is a well-researched field. In our first visualization tests, we were looking for radically different solutions, but these did not prove convincing. So, rather than starting from scratch, we realized that thermal comfort could be understood through rich interactions, rather than through sophisticated visualization. We tried to ensure interaction feedback was fast in order to encourage users to play with the app.
Solution
We combined the datasets to show correlations between external factors, or the type of insulation, and the temperature felt. Thus, users visualize the evolution of comfort in the home as they manipulate the various parameters of the prototype. In order to visually embody the temperature felt with regard to various external factors, we used spatial distribution and proximity algorithms.
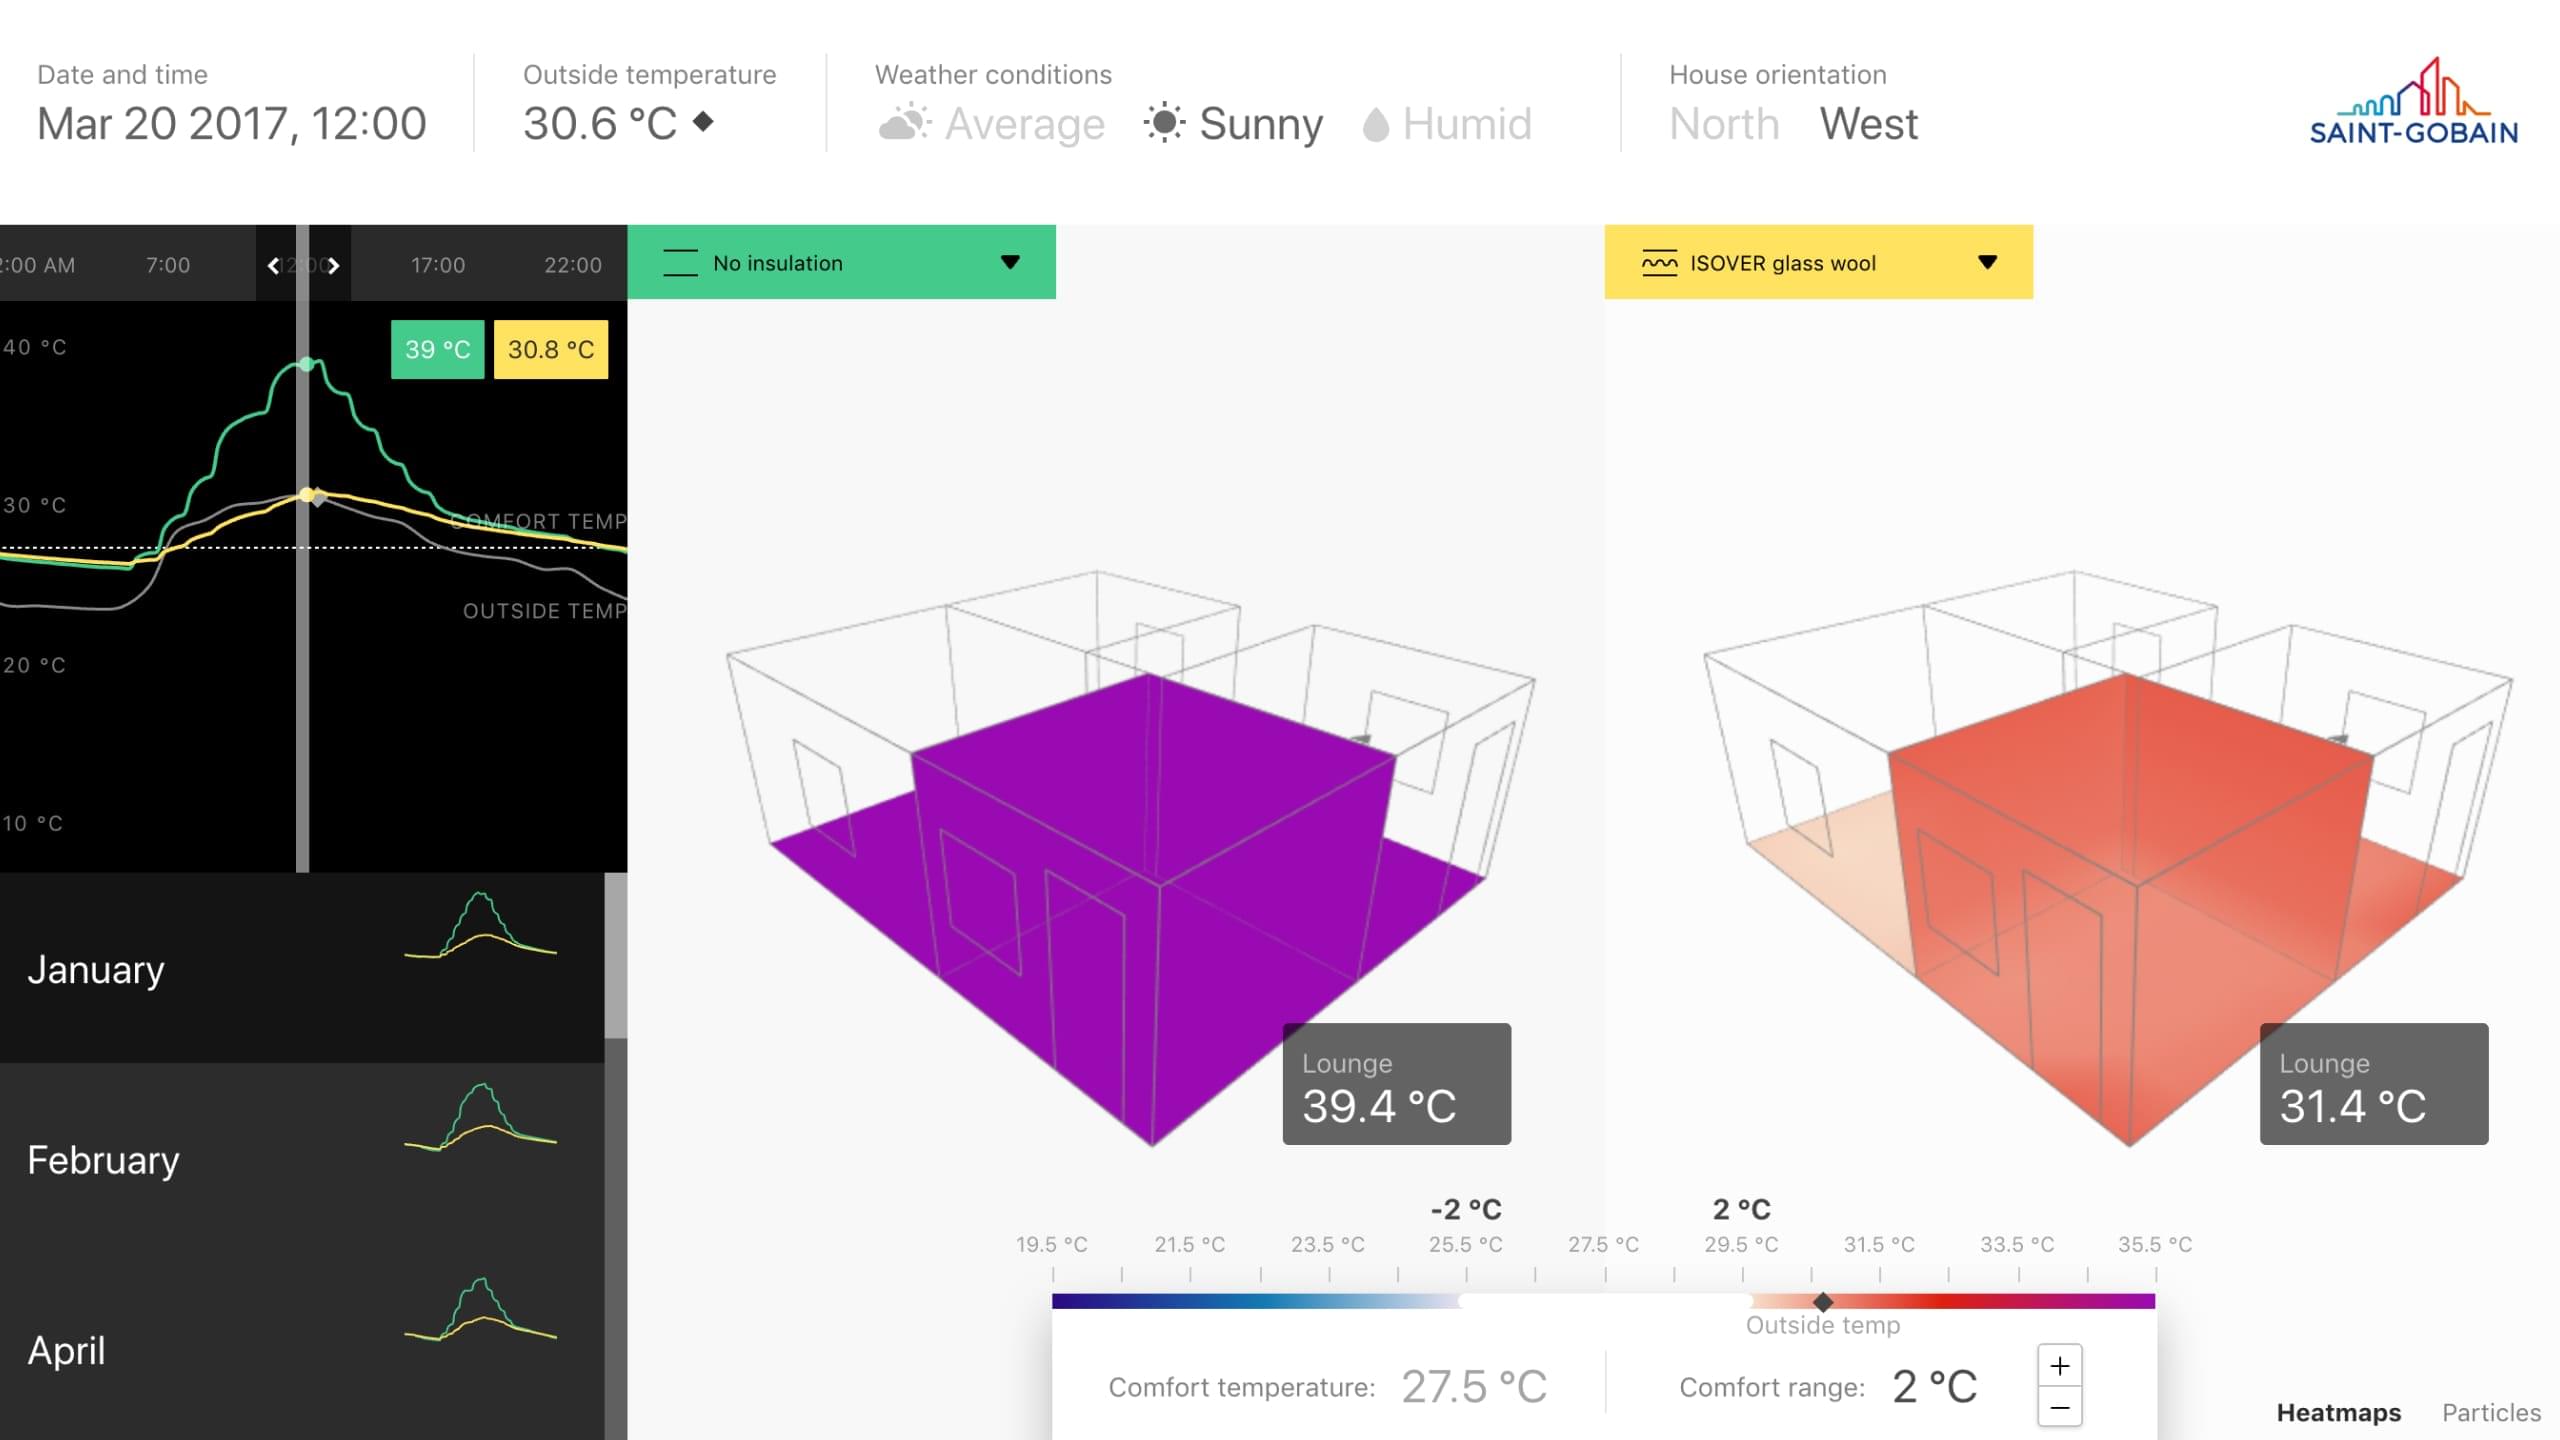
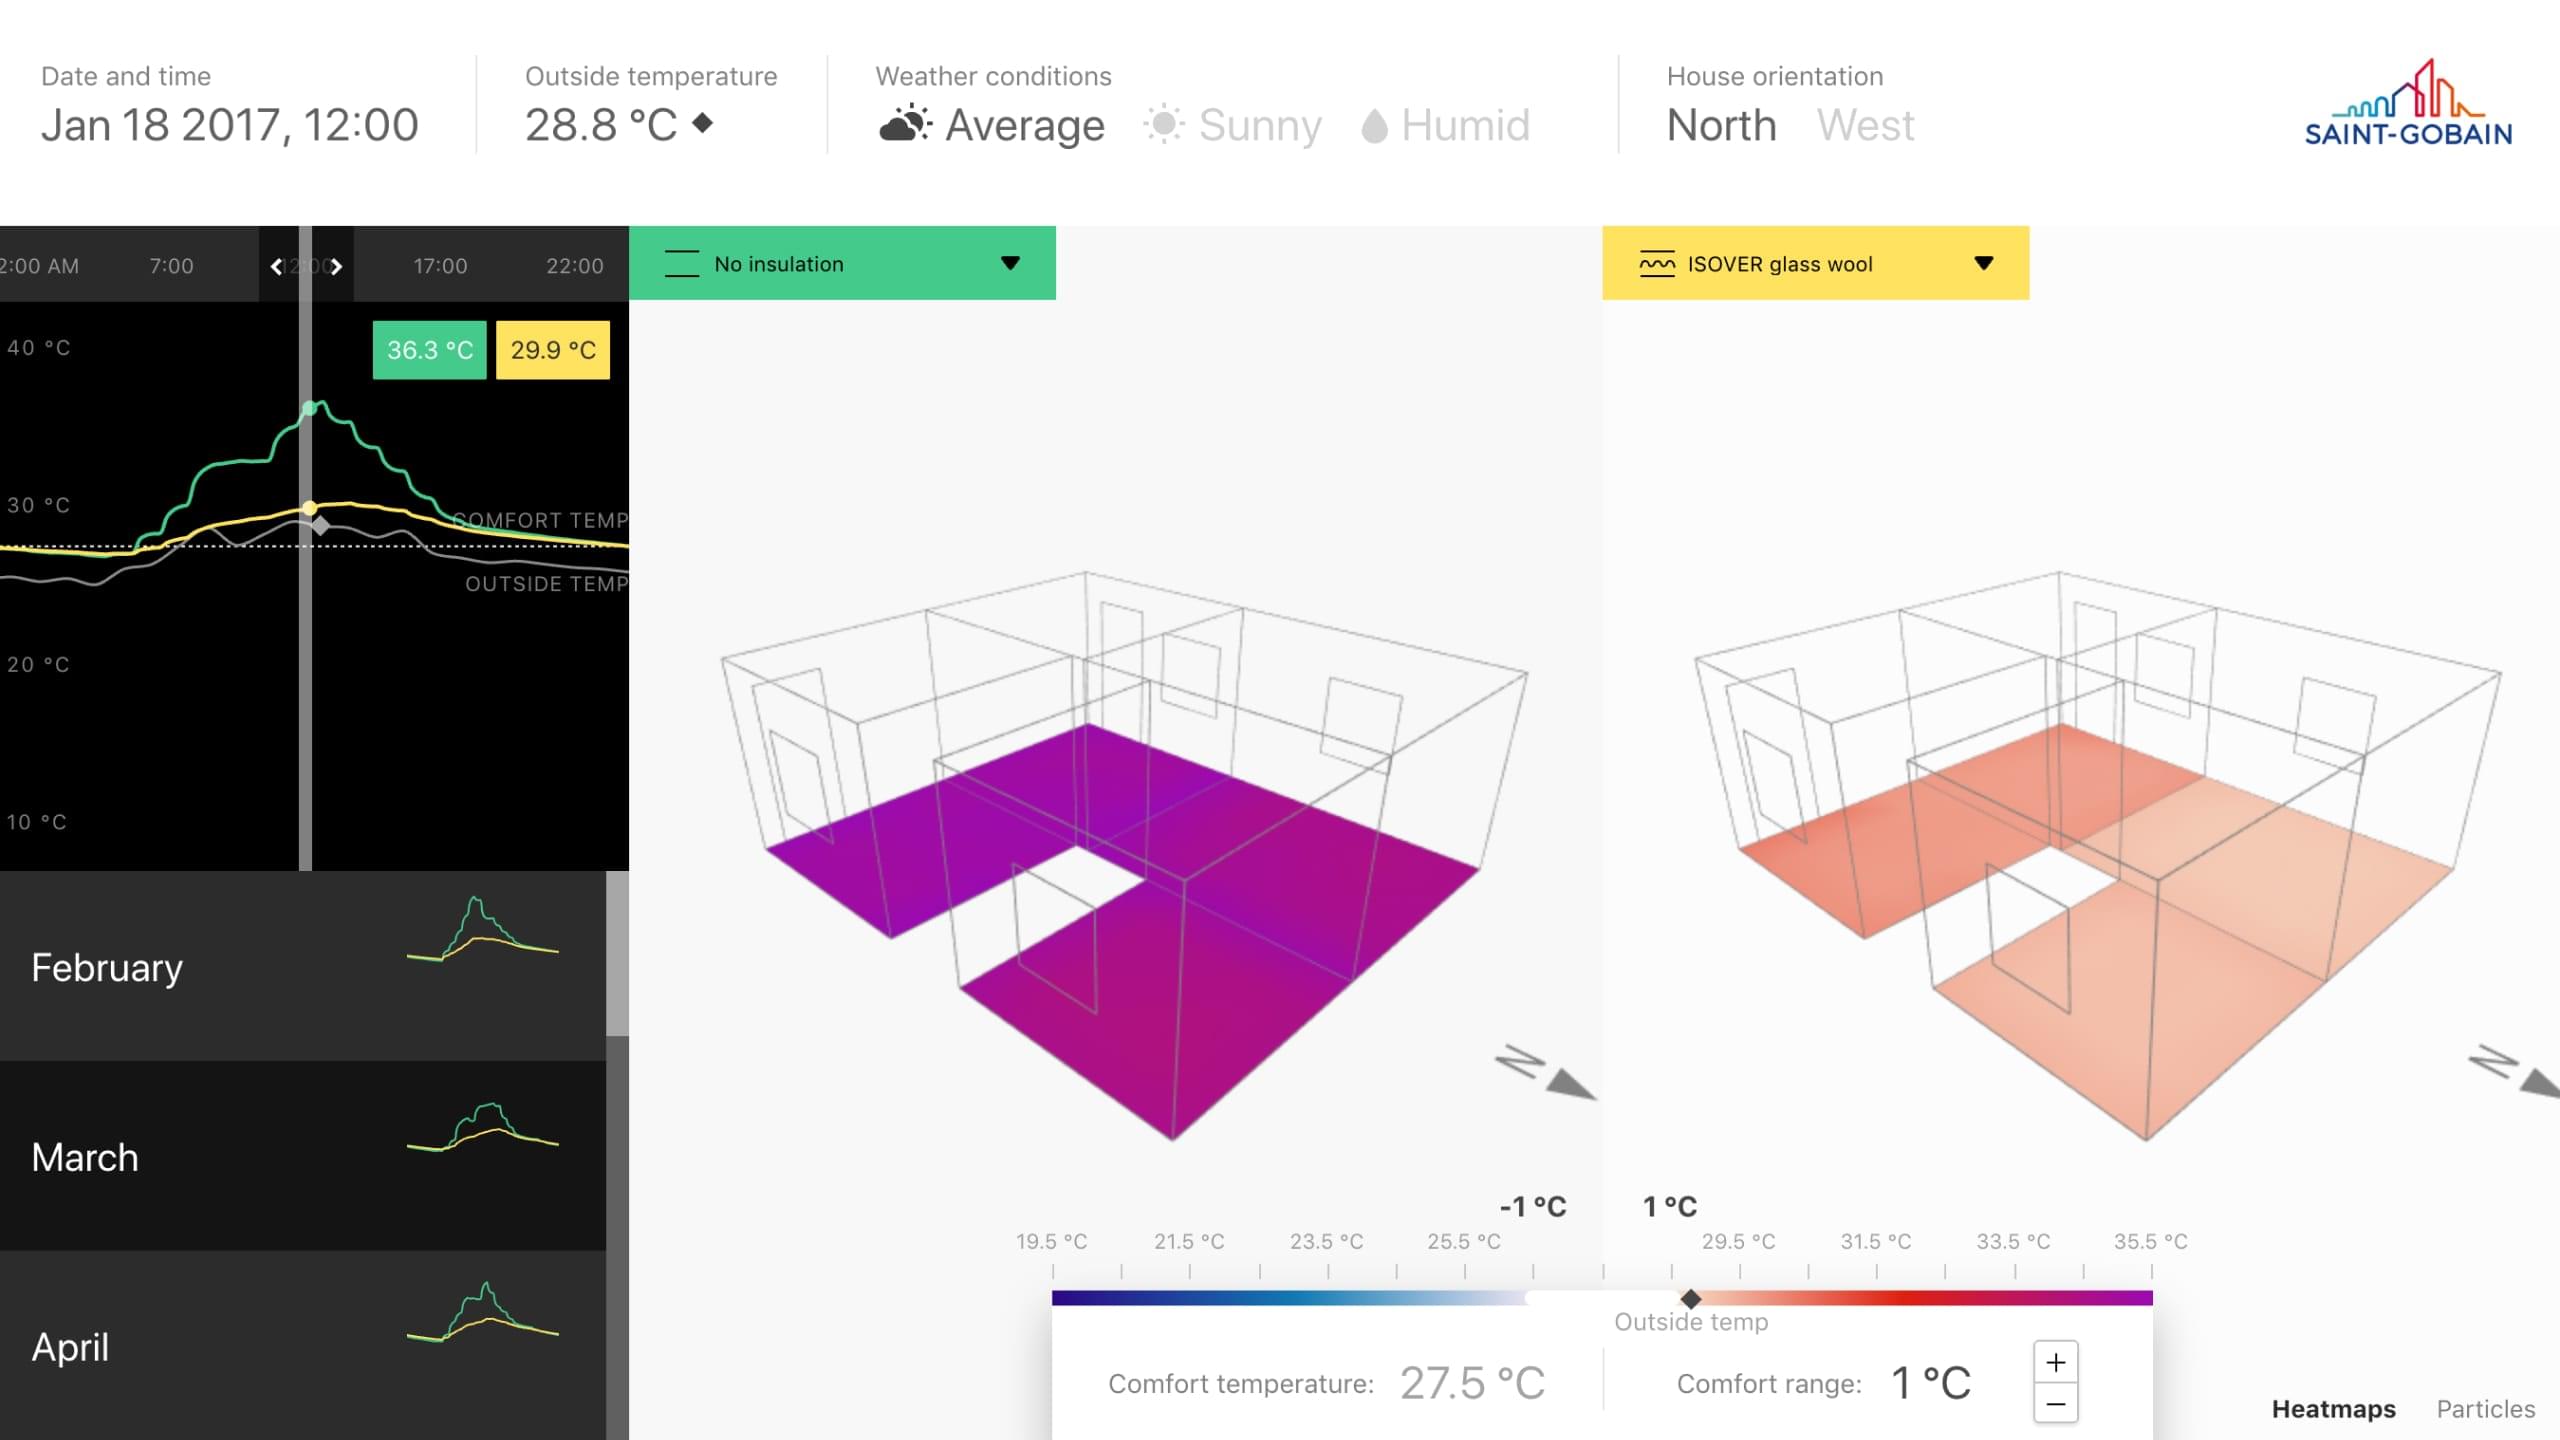
The center of the screen shows a side-by-side comparison of the thermal performance of two roofs with different insulation materials.
A large number of interactors make it possible to manipulate temporal, spatial, meteorological, and feeling parameters, with great precision and speed.
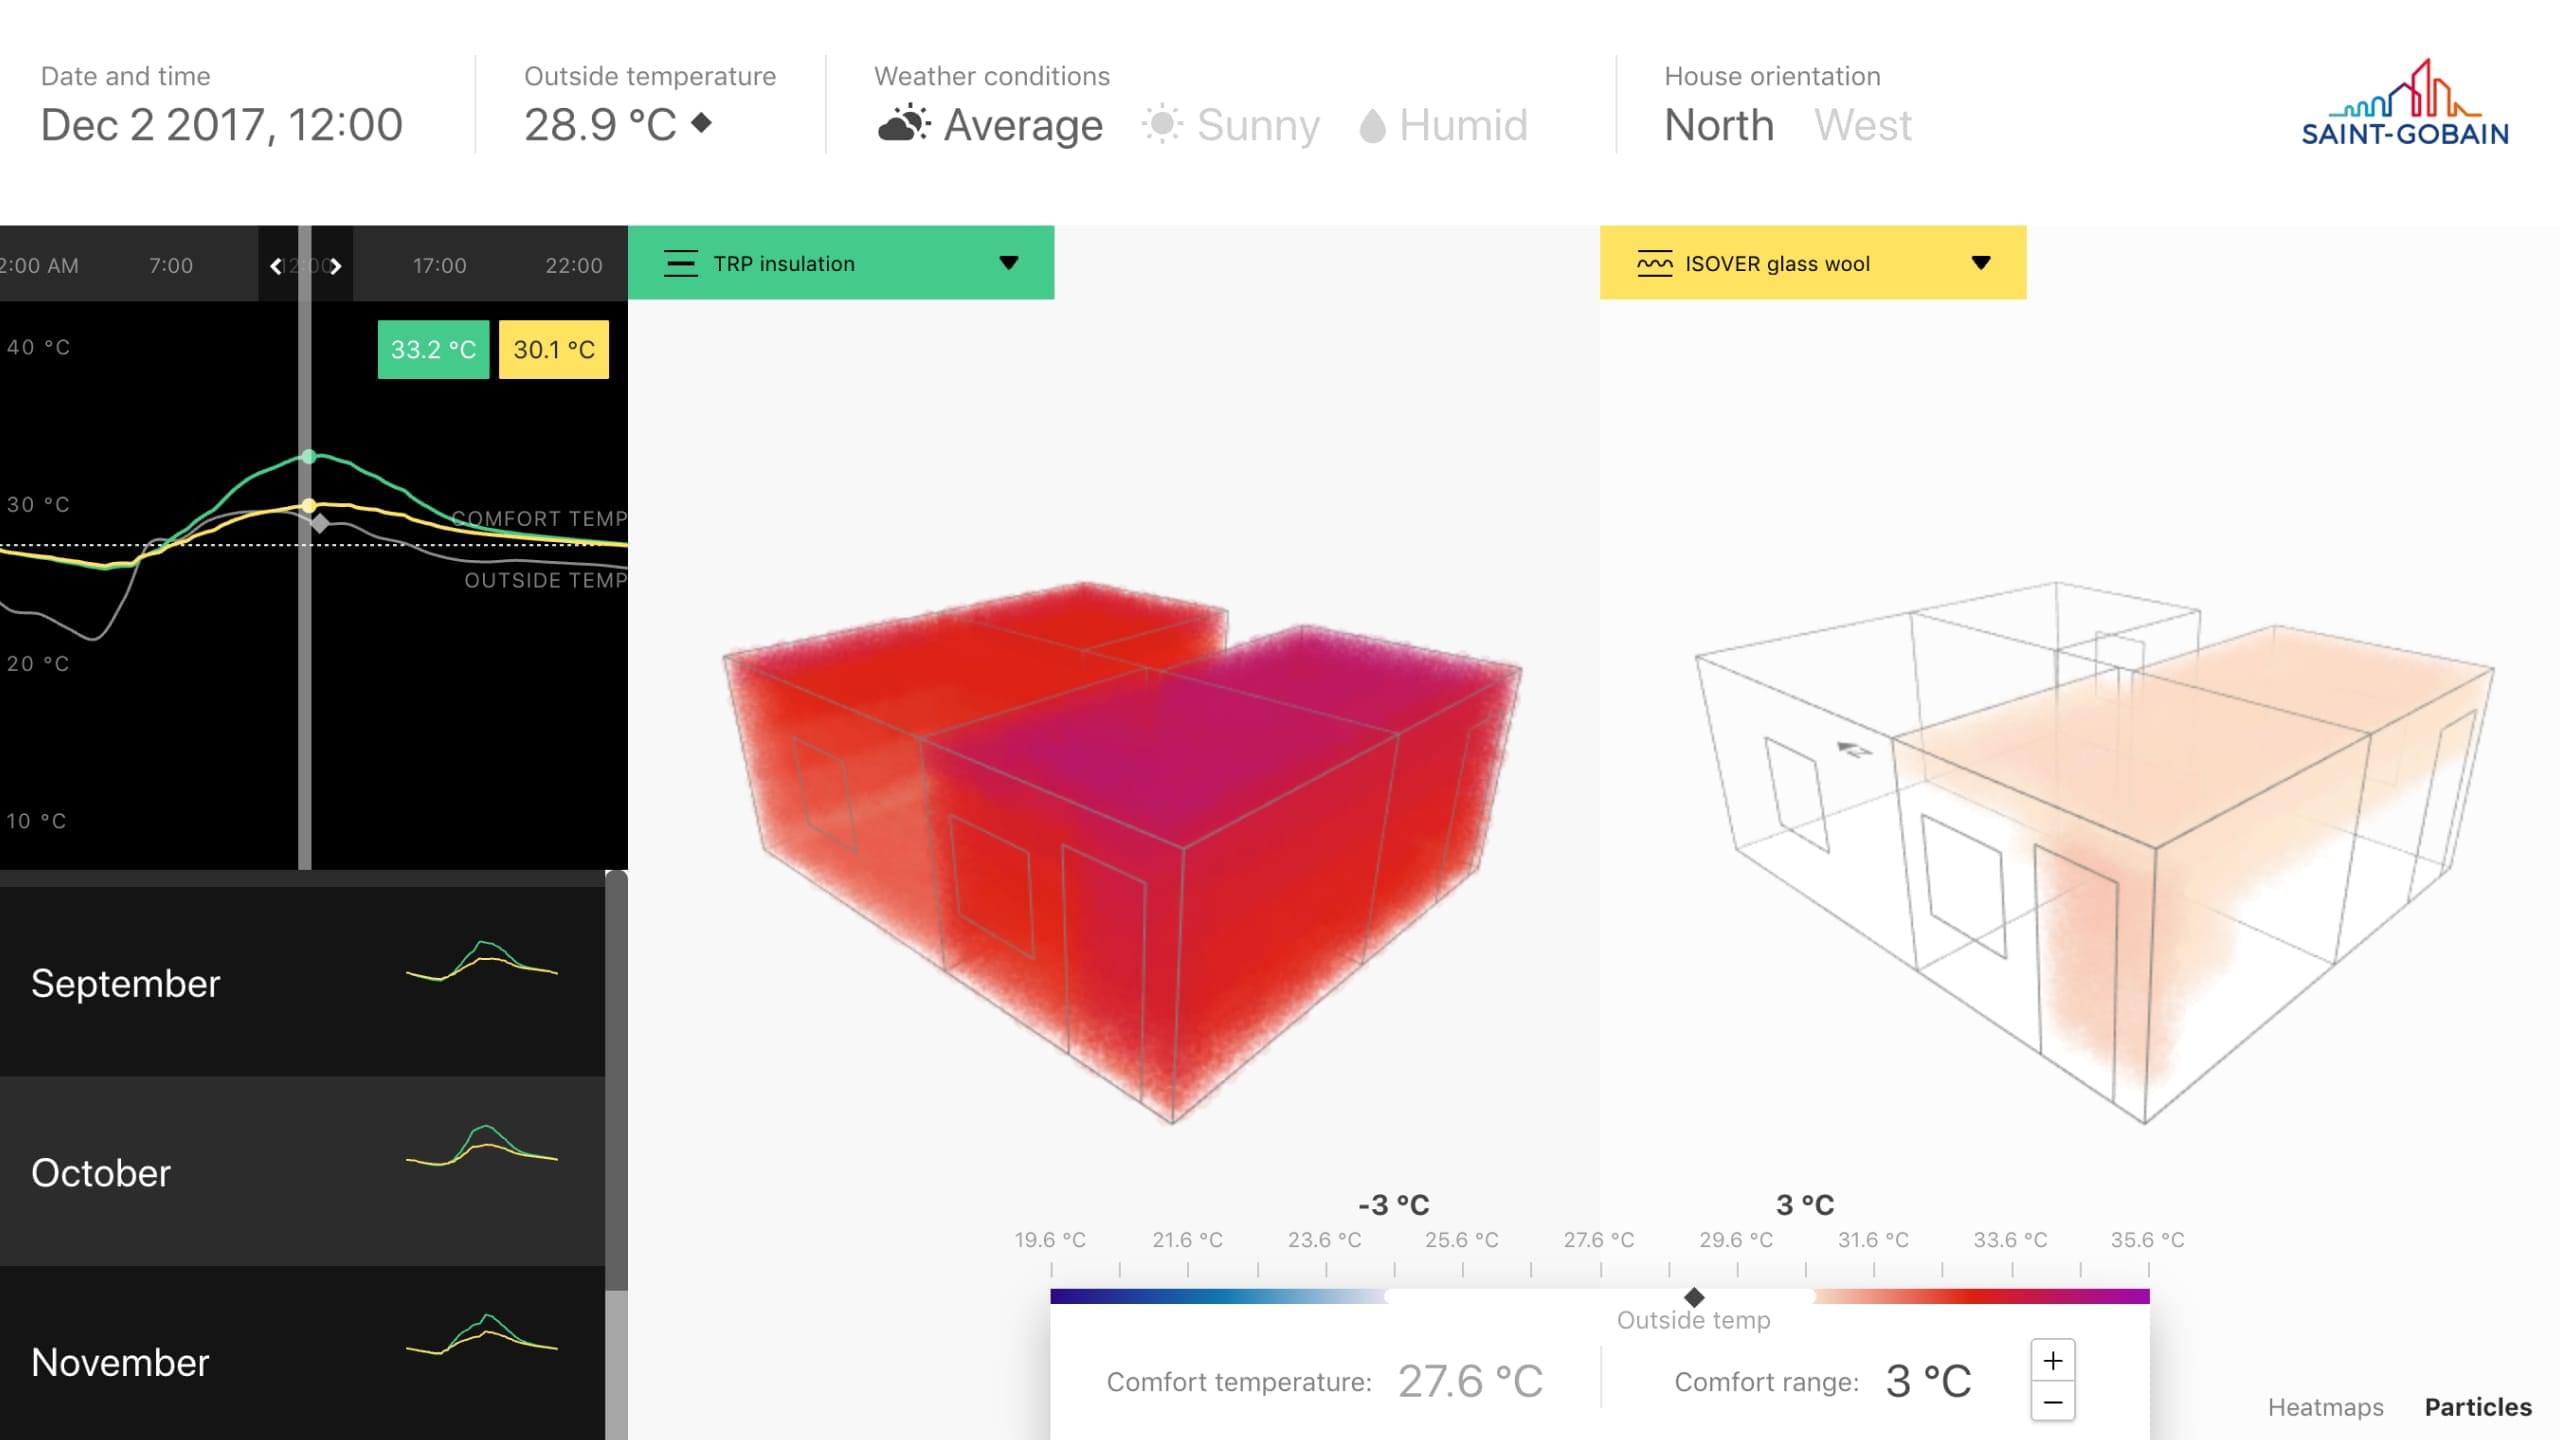
Thanks to the rich and immediate interactions, thermal comfort can be felt and compared, thus becoming a game.
Highlight
At the heart of the prototype are two houses side by side, showing the difference in performance between two roofs, each insulated with a different material. Our prototype allows users to manipulate several complementary dimensions on these houses.
The first dimension is time. The user can choose a season, a month, an hour of the day, or even the most representative days of a season in the year.
The next dimension is space. The user manipulates a simplified 3D plan of the house, showing the walls, doors and windows. Each room in the house changes color and particles as the user moves through time or changes the exterior settings.
Finally there are the external parameters. The user can modify the orientation of the house, the degree of humidity or dryness, the type of roof, and even experiment with sensitivity by defining different ranges of comfort around the ideal temperature.
All these interactions have a simultaneous effect on the two homes compared in the application: the rotations and translations in the 3D window are synchronized. This simplifies interactions and eases the cognitive load of having to make visual comparisons of two dissimilar objects.
Thierry Voillequin
Virtual Reality Director, chez Saint-Gobain Research Paris
Subscribe to our newsletter:
75010 Paris
France